
The U.S. Remains The World’s Top Oil Producer
Earlier this month BP released its Statistical Review of World Energy 2022. The Review provides a comprehensive picture of the supply and demand for major energy sources on a country-level basis. Each year, I do a series of articles covering the Review’s findings.
In the previous article, I discussed the trends in global carbon dioxide emissions. Today, I want to cover the production and consumption of petroleum.
Oil Demand Bounces Back
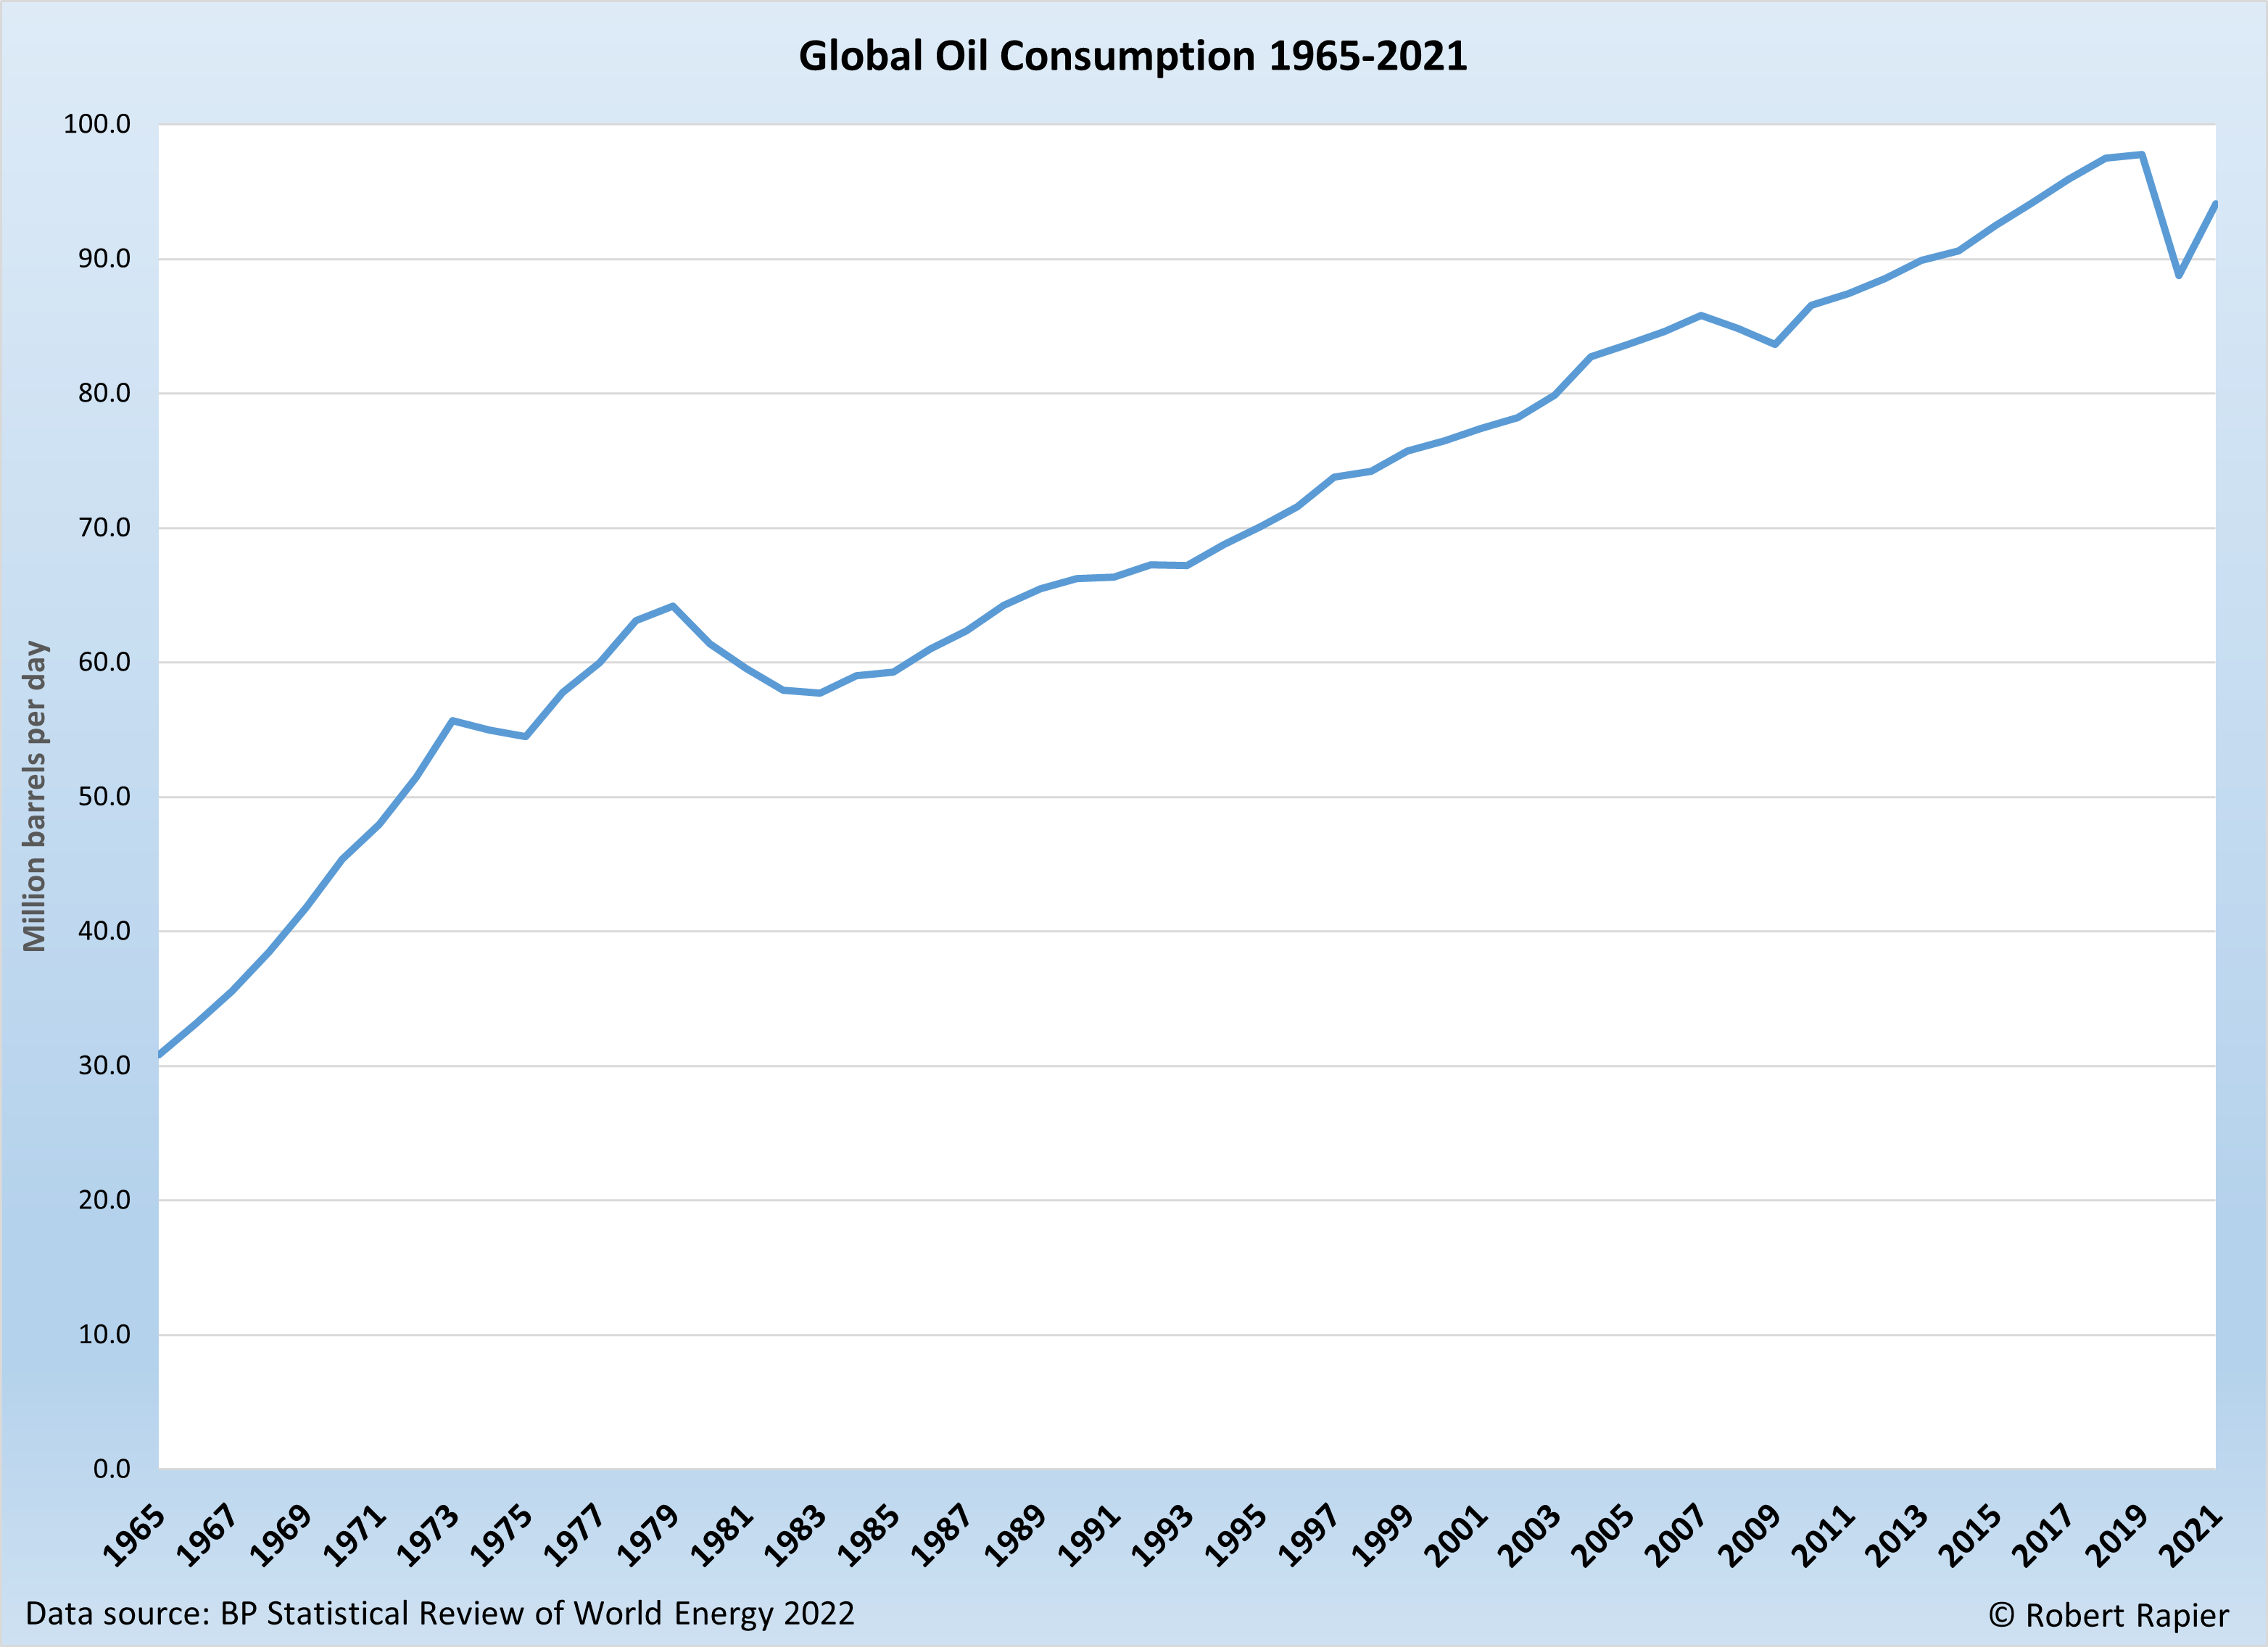
For 2020, the Review reported the largest decline in oil1 consumption on record. After nine consecutive years of increase, the Covid-19 pandemic caused global consumption of crude oil to decline by more than 9% in 2020. Last year oil consumption bounced back by climbing 6% — the fastest rise since 1976. However, consumption remains 3.7% below the record level of 2019.
The United States remains the world’s top oil consumer, averaging 18.7 million BPD in 2021. This marked an increase of 8.7% from 2020 (reflected by “Change” in the table below). This was the sharpest increase for any country in the Top 10, but it is still 9% below the all-time high U.S. oil consumption level of 2005 (20.5 million BPD).
China was the second-highest consumer at 15.4 million BPD. Over the past decade, U.S. oil consumption has increased by an average annual rate of 0.4%, while China’s average annual increase was more than 10 times higher at 4.8%.
Germany was notably the only country in the Top 10 that saw a demand decline in 2021.

The U.S. Remains Oil Production Champion
Despite the ongoing impact the pandemic has had on U.S. oil production, the U.S. remained the world’s top oil producer in 2021 at 11.2 million BPD.2 Russia and Saudi Arabia retained their positions at #2 and #3.
Although oil companies around the world did begin to increase production during 2021, average production for the year fell for 6 of the Top 10 countries. This was a major driver behind the global surge in oil prices in 2021.
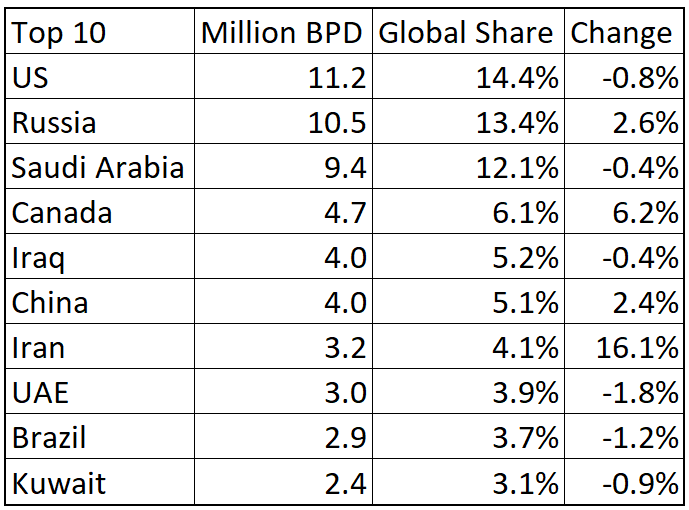
Note that these production numbers are for crude oil and lease condensate. The U.S. also leads all countries in the production of natural gas liquids (NGLs), which partially end up in the oil products supply chain. If NGLs are included, the U.S. has an even larger lead over Russia and Saudi Arabia.
Footnotes
1. BP’s definition of oil consumption excludes biofuels while derivatives of coal and natural gas are included.
2. Includes crude oil, shale/tight oil, oil sands, lease condensate, or gas condensates that require further refining. Excludes liquid fuels from other sources such as biomass and synthetic derivatives of coal and natural gas.
More By This Author:
Why The U.S. Alone Can’t Curb The World’s Carbon Dioxide EmissionsFrom Pariah To Partner: The Healing Power Of High Gasoline Prices
Highlights From The 2022 BP Statistical Review
Follow Robert Rapier on Twitter, more


