Join Our Telegram channel to stay up to date on breaking news coverage
BCH Loses at $135 – July 27
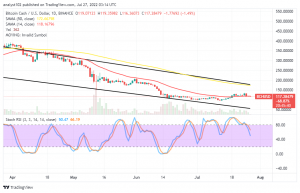
From a close observation technical point of view, Bitcoin Cash loses at the $135 line after hitting resistance around the value line. The last thirty days of trading have witnessed a decrease and an increase in valuation of $96 and $134.44. And the market price, as of writing, keeps a negative percentage rate of 1.49.
BCH Price Statistics:
BCH price now – $116.85
BCH market cap – $2.2 billion
BCH circulating supply – 19.1 million
BCH total supply – 19.1 million
Coinmarketcap ranking – #29
BCH Loses at $135: BCH Market
Key Levels:
Resistance levels: $140, $160, $180
Support levels: $100, $90, $80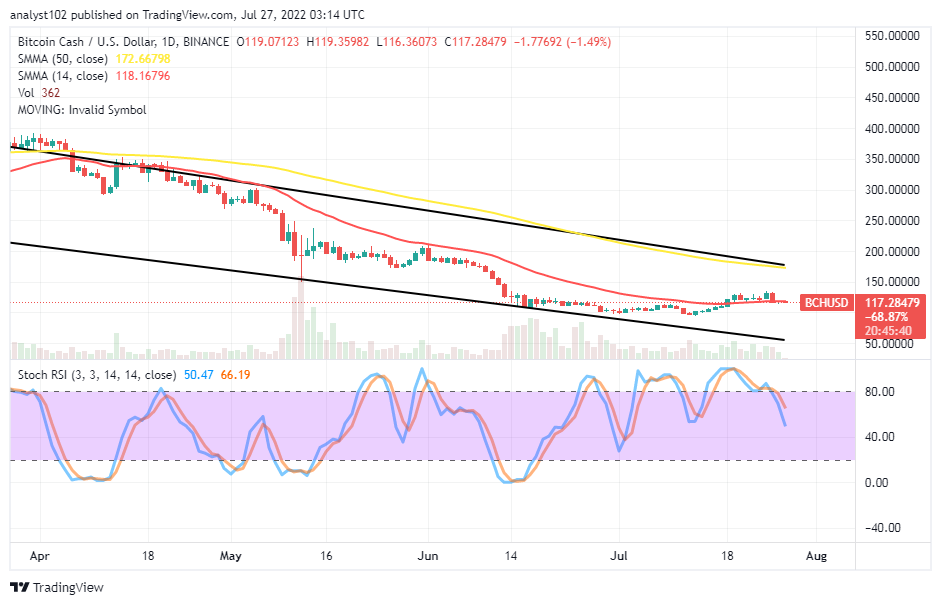 BCH/USD – Daily Chart
The BCH/USD daily chart reveals the crypto economy loses at the $135 trading level after a brief breach of the smaller SMA trend line to the upside. The 14-day SMA indicator is at $118.16796 below the 50-day SMA indicator, which is at $172.66798. The upper bearish trend line drew alongside the bigger SMA. The Stochastic Oscillators have crossed southbound from the overbought region, pointing toward the 40 range to denote prices are in a downward motion.
Will the BCH/USD push downward aggressively past the 14-day SMA indicator soon?
The situation has shown that the BCH/USD price loses at the $135 resistance. Despite the prevalence of a downward-trending force, the price seems not to give in to an aggressively-moving manner. That said, long-position placers would have to exercise patience at this moment until a formation that will signify less-active motions to the downside occur afterward at a lower-trading spot before considering a buying order.
On the downside of the technical analysis, as there has been a falling force at the $135 level, the BCH/USD market bears will have to guide against any sudden upsurge in the market that can summarily lead to a rebound by applying for a stop loss order at or around that point. In the event of the downward motions, getting heightening, the price may push toward achieving a low support point of around $90 in the long-term run on a slow-and-steady moving mode afterward.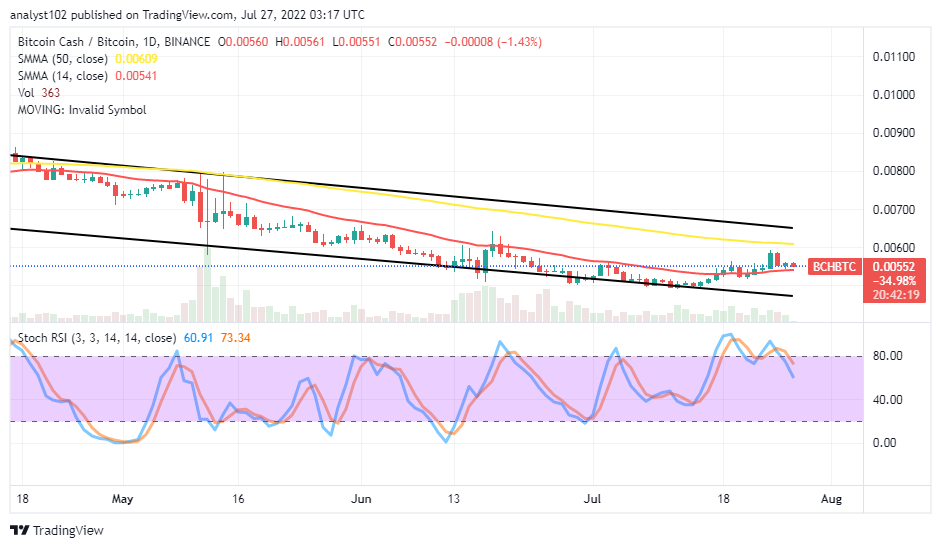
BCH/BTC Price Analysis
Bitcoin Cash’s trending worth compared with Bitcoin has been pushing feebly against its countering instrument closely over the trend line of the smaller SMA. The trading situation between the two pairing cryptos showcases the market losses at a resistance below the bigger-SMA trend line. The bearish channel trend lines drew to enclose the SMAs to indicate the price is still under falling pressure. The Stochastic Oscillators have crossed southbound from the overbought region. And they are closely underneath the 80 range, pointing to the downside to suggest the base crypto may go down against its counter-trading crypto in the following sessions. But, it could be in a low-active force.
Read more:
- How to buy Bitcoin-cash
- How to buy cryptocurrency
- Bitcoin Cash Price Prediction – BCH/USD Searches for Support, Price Breakdown to $230
Join Our Telegram channel to stay up to date on breaking news coverage