Oil Prices Eyes February Low Following Upward Adjustment In OPEC Output

The price of oil struggles to hold its ground after closing below the 200-Day SMA ($94.58) for the first time in 2022, and the recent announcement by OPEC may keep crude under pressure as the group plans to increase production by “0.1 mb/d for the month of September 2022.”
The upward adjustment in the production schedule suggests OPEC will gradually respond to high energy prices as the group argues that “chronic underinvestment in the oil sector has reduced excess capacities along the value chain,” and it remains to be seen if the organization will boost crude output over the coming months as the US Gross Domestic Product (GDP) report warns of a recession.

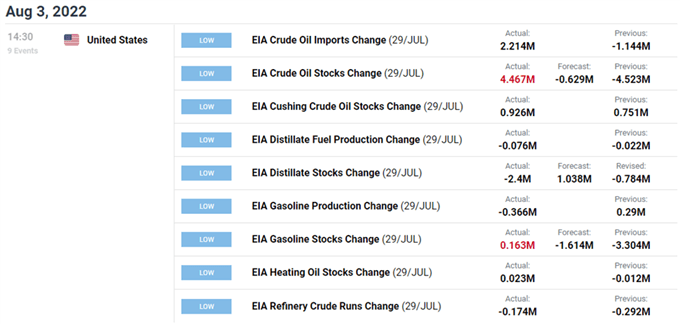
At the same time, recent updates from the Energy Information Administration (EIA) cast a weakened outlook for energy consumption as crude inventories unexpectedly increase 4.467M in the week ending July 29, and higher supply paired with signs of slowing demand may continue to drag on the price of oil as US output approaches pre-pandemic levels.

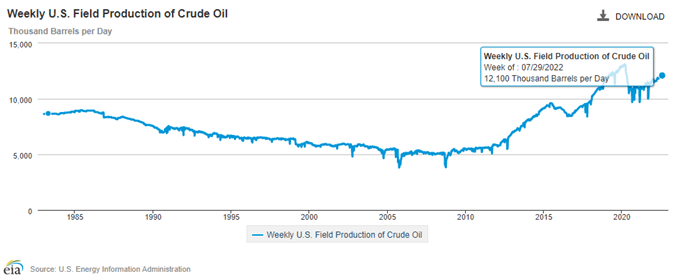
A deeper look at the figures from the EIA show weekly field production printing at 12,100K for the second week, and current market conditions may lead to a further correction in the price of oil as OPEC takes additional steps to boost supply.
With that said, crude appears to be on track to test the February low ($86.55) after clearing the July low ($90.56), and the price of oil may face headwinds ahead of the next OPEC Ministerial Meeting on September 5 amid the weakening outlook for consumption.
CRUDE OIL PRICE DAILY CHART
(Click on image to enlarge)

Source: Trading View
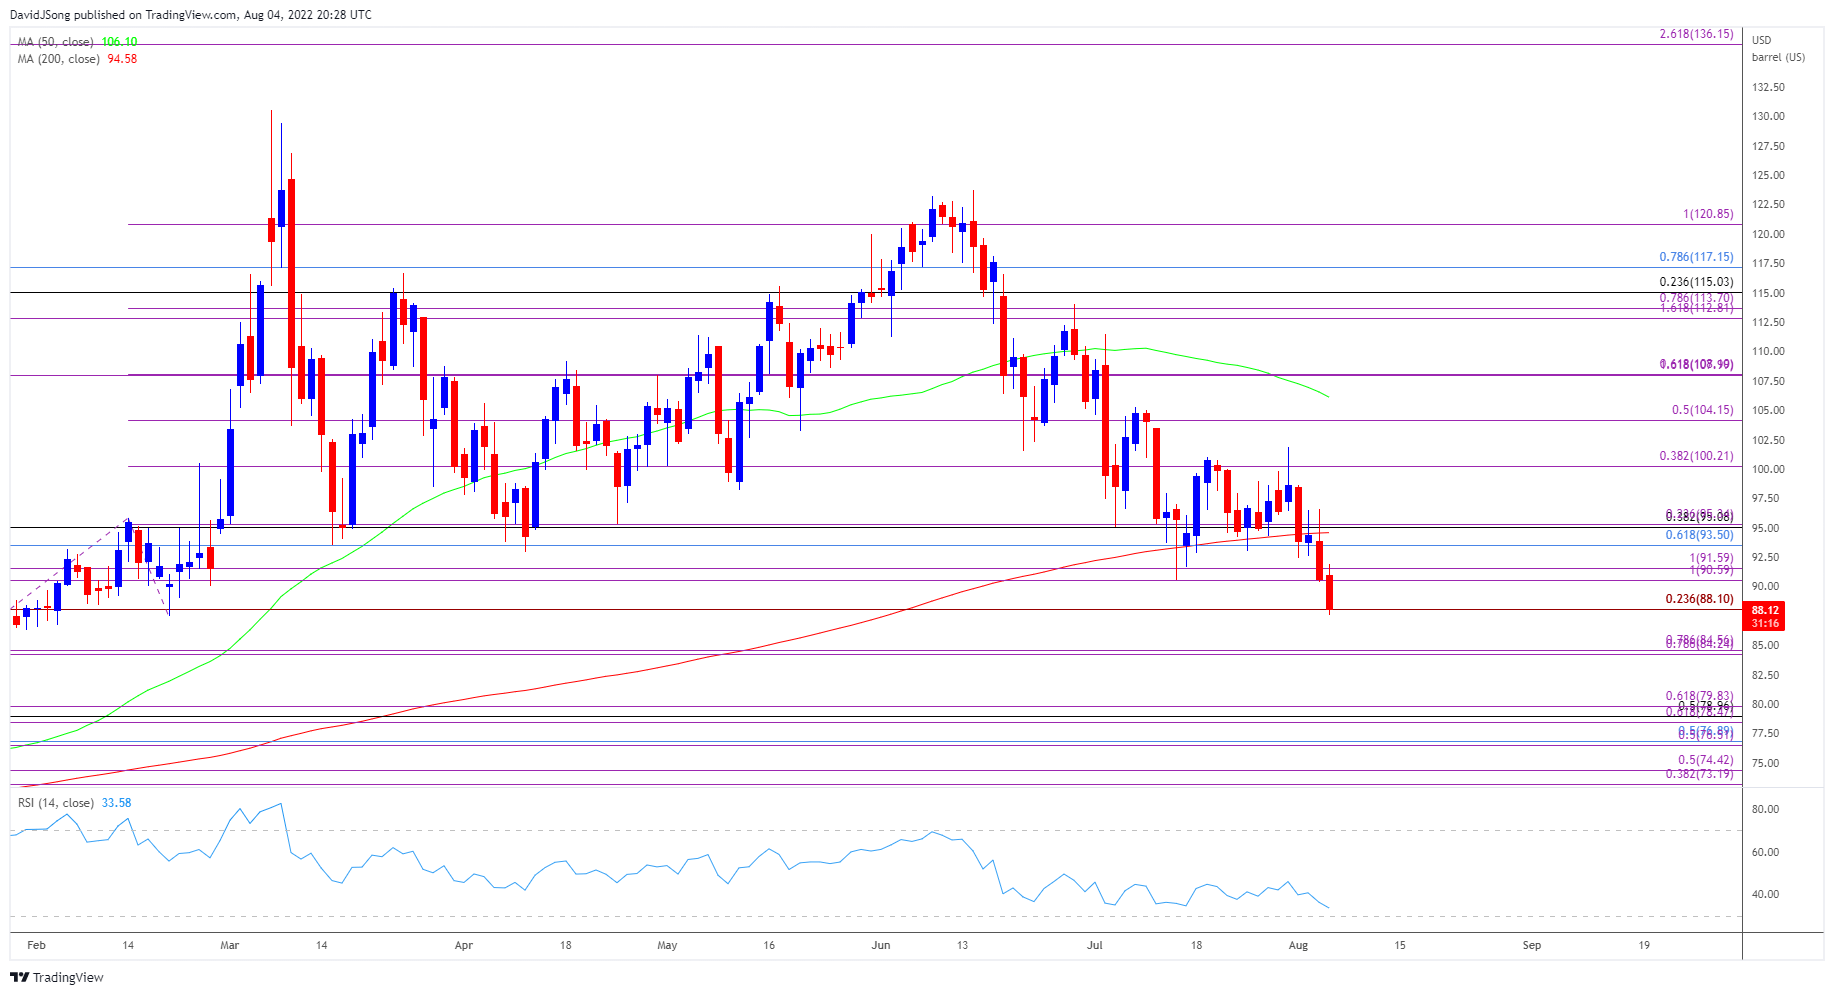
- The price of oil appeared to be reversing ahead of the February low ($86.55) amid the string of failed attempts to close below the 200-Day SMA ($94.58), but recent price action raises the scope for a further decline in crude as it takes out the July low ($90.56).
- Need a close below $88.10 (23.6% expansion) to bring the $84.20 (78.6% expansion) to $84.60 (78.6% expansion) region on the radar, with the next area of interest coming in around $78.50 (61.8% expansion) to $79.80 (61.8% expansion).
- Looming developments in the Relative Strength Index (RSI) may show the bearish momentum gathering pace as the recent weakness in the price of oil pushes the oscillator towards oversold territory, with a move below 30 in the oscillator likely to be accompanied by a further decline in crude prices like the behavior seen during the previous year.
More By This Author:
Gold Price To Mirror June On Failure To Push Above 50-Day SMA
USD/CAD Forecast: US, Canada Employment Reports In Focus
USD/JPY Susceptible to Larger Correction on Break Below 50-Day SMA
Disclosure: See the full disclosure for DailyFX here.


