
IMPORTANT UPDATE, apx 35 minutes before futures open AS WE CLOSE OUR SHORT TRADE, and take a small loss of 0.7%, and realized loss of 3.5% due to the 5 to 1 leveraged trade. Why is the original trade idea aborted? There are some interesting insights for any traders, at any time, within this decision.
- Traders need to be on the lookout for significant signs that come about after entering their trades. There is definately a lot of benefit in sticking to the original trade idea, and that is what should be done in most cases. However, every rule has got an exception and this is one of them.
- Ethereum, which is influencing Bitcoin, is showing strength as it has broken out of the bull flag show, and is maintaing (so no failed break out yet). It is also maintaining above the 20 EMA shown in the video.
- This is enough as an anticipation that a breakout up in ETHUSD is possibly imminent, and with futures opening in apx 40 minutes, that event can be a trigger to another rally for crypto as well
- In any case, ETHUSD staying above the bull flag that was broken to the upside, is enough. If price goes back down into the channel, and a 4hr candle is closed within it, the bearis premise can be reviewed.
- Traders must be agile and KEEP THEIR LOSSES short. In this case, we exit quickly, in light of this significant evidence, with a loss of 0.7%, which is a 3.5% loss at a leverage of 5 to 1. This is quite minor within leveraged crypto trading
So see why we are taking a small loss and aborting fast within the following ETHUSD technical analysis video, which is expected to influence Bitcoin as well (Ethereum is the leading force of the crypto markets, these days, technically):
--- End of Update, the following is the previous analysis and short trade idea for bitcoin ----
BTCUSD had a nice rally above 3% yesterday but volume is not strong and bitcoin can easily test the 20k mark or close to it. We aim for a short position with a 'take profit' target that is in line with testing an important VWAP, and is much higher than that 20 thousand dollar key price point. In fact, we aim to take profit and exit the trade even above 21k, at $21421
Still, in crypto trading, this is above 7.5% move, and at a leverage of 5 to 1, this is almost a 40% return on the capital committed on the trade. Remember that we are not suggested or telling you to trade, nor is this a signal service. It is an opinion and through that perspective, we also show a view of the current technical analysis for bitcoin. In this case, on the daily timeframe. In other words, our trade idea is a means to show you a certain technical analysis.
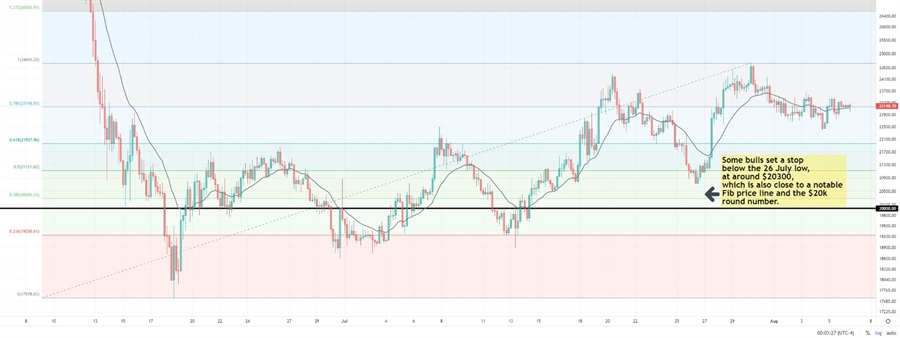
Firstly, some bulls have probably set a stop below a recent key low that they see. A prominent one is the 26 July low, so they would set their stops at around $20300. This price level is close to a notable Fib price level (0.382) and not far from a key 'round number' and key price level of $20k. If institutions want to stop out the bulls, even those that think they set a healthy, distant stop, then BTCUSD could easily go down within the range of $19900 to $20600, to have those bulls hit their stops.
Secondly, in this specific technical analysis for the crypto king, we analyze the BTCUSD price chart using an Anchored VWAP. It ties calculations to a price bar that the trader has chosen. It is like the traditional VWAP in that it uses a weighted average of the price and the number of trades. It can also find the areas of support and resistance on the chart, just like VWAP. In this case, we anchor the VWAP from the pivot point and the low of the recent period, which is 17567, the low of 18th of June.
Thirdly, BTCUSD had made 4 pushes up since that low, creating what some algos and pro traders would view as ascending wedge. A rising wedge pattern is a bearish chart pattern that shows a breakdown may be coming soon, in probability that is higher than 50%. That is a a suffient chance when taking into consideration that the profit target here is 1.5 times the risk (the distance from the entry to the stop loss).
Who knows, maybe this bitcoin price forecast is partially affected by a bias because every U.S. Crypto Exchange (and Binance) is being investigated by the SEC.
Technical analysis OSCILLATORS, for BTCUSD on a weekly timeframe:
When analyzing technicals for bitcoin vs the USD, one can look at oscillators as a technical analysis tool that provides a trend indication inside high and low ranges. The trend indicator identifies short-term overbought or oversold conditions.
Looking at the weekly timeframe, BTCUSD is fairly neutral, according to the following technical analysis of oscillators and their values.
| Name | Value | Action |
| Relative Strength Index (14) | 34.47 | Neutral |
| Stochastic %K (14, 3, 3) | 22.86 | Neutral |
| Commodity Channel Index (20) | -65.50 | Neutral |
| Average Directional Index (14) | 30.38 | Neutral |
| Awesome Oscillator | -13525.61 | Neutral |
| Momentum (10) | -6437.89 | Buy |
| MACD Level (12, 26) | -5647.67 | Sell |
| Stochastic RSI Fast (3, 3, 14, 14) | 55.28 | Neutral |
| Williams Percent Range (14) | -75.78 | Neutral |
| Bull Bear Power | -4914.46 | Neutral |
| Ultimate Oscillator (7, 14, 28) | 48.55 | Neutral |
Technical analysis MOVING AVERAGES, for BTCUSD on a weekly timeframe:
When analyzing technicals for bitcoin vs the USD, one can look at moving averages to examine the BTCUSD weekly trend. Sum all the data points for a given time period and divide by the number of time periods. Moving averages help technical traders.
Looking at the weekly timeframe, BTCUSD is fairly weak, according to the moving average indicators and their values.
| Name | Value | Action |
| Exponential Moving Average (10) | 24148.00 | Sell |
| Simple Moving Average (10) | 22787.61 | Buy |
| Exponential Moving Average (20) | 28512.36 | Sell |
| Simple Moving Average (20) | 30298.06 | Sell |
| Exponential Moving Average (30) | 31851.81 | Sell |
| Simple Moving Average (30) | 33377.81 | Sell |
| Exponential Moving Average (50) | 35051.83 | Sell |
| Simple Moving Average (50) | 41121.50 | Sell |
| Exponential Moving Average (100) | 33897.67 | Sell |
| Simple Moving Average (100) | 38079.96 | Sell |
| Exponential Moving Average (200) | 26560.80 | Sell |
| Simple Moving Average (200) | 22874.76 | Buy |
| Ichimoku Base Line (9, 26, 52, 26) | 32903.73 | Neutral |
| Volume Weighted Moving Average (20) | 28652.57 | Sell |
| Hull Moving Average (9) | 22864.15 | Buy |
Update on the trade idea provided (short BTCUSD):
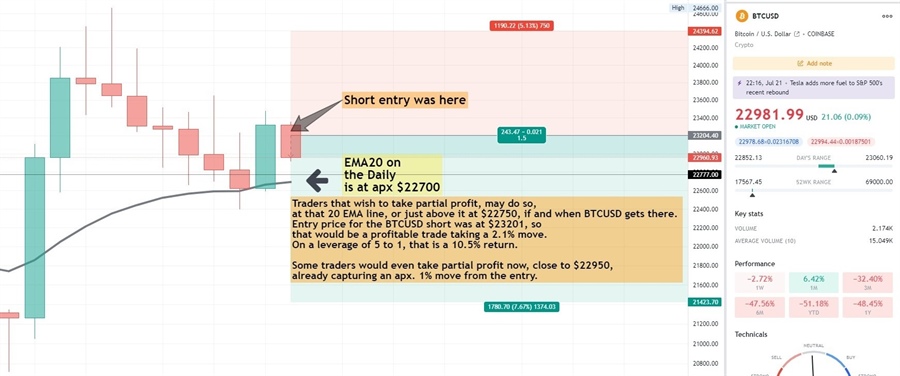
Traders that wish to take partial profit, may do so, at that 20 EMA line, or just above it at $22750, if and when BTCUSD gets there. Entry price for the BTCUSD short was at $23201, so that would be a profitable trade taking a 2.1% move. On a leverage of 5 to 1, that would be a 10.5% return.
Some traders would even take partial profit now, as BTCUSD erased its current daily gain and is at apx, $22970, pocketing over a leveraged profit for over a 1% move, equivalent to a 5% profit on the 5-to-1 leveraged trade.
---------------------
For this update, we used TradingView, a great tool for new and seasoned chartists, traders and investors. Trade bitcoin or any other crypto currencies at your own risk only. Visit ForexLive technical analysis for other technical examinations of a variety of financial assets.

