
Soft Commodities Speculator Bets Go Slightly Higher Led By Live Cattle & Lean Hogs
Here are the latest charts and statistics for the Commitment of Traders (COT) data published by the Commodities Futures Trading Commission (CFTC).
The latest COT data is updated through Tuesday August 9th and shows a quick view of how large traders (for-profit speculators and commercial entities) were positioned in the futures markets.
Weekly Speculator Changes
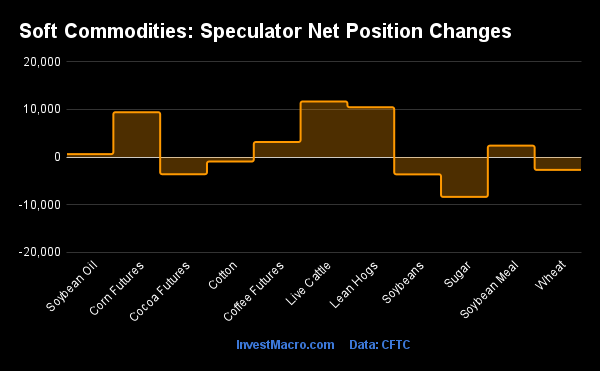
COT soft commodities speculator bets were slightly higher this week as six out of the eleven soft commodities markets we cover had higher positioning this week while the other five markets had lower contracts.
Leading the gains for soft commodities markets was Live Cattle (11,693 contracts) and Lean Hogs (10,480 contracts) with Corn (9,431 contracts), Coffee (3,169 contracts), Soybean Meal (2,400 contracts) and Soybean Oil (626 contracts) also having increasing bets this week.
The softs market leading the declines in speculator bets this week was Sugar (-8,373 contracts) with Soybeans (-3,626 contracts), Cocoa (-3,605 contracts), Wheat (-2,701 contracts) and Cotton (-940 contracts) also seeing lower bets on the week.
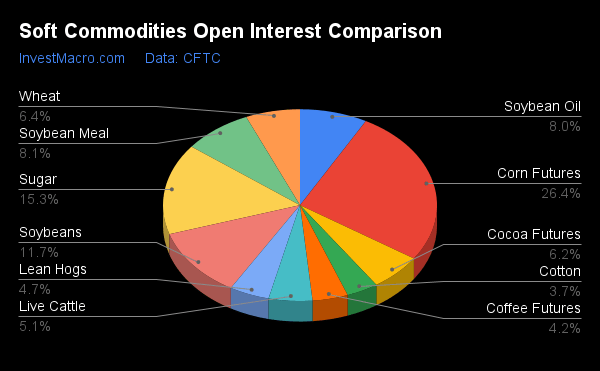
Data Snapshot of Commodity Market Traders | Columns Legend
| WTI Crude | 1,570,131 | 0 | 210,651 | 0 | -238,073 | 100 | 27,422 | 53 |
| Corn | 1,317,913 | 1 | 210,786 | 57 | -160,654 | 49 | -50,132 | 14 |
| Natural Gas | 969,582 | 3 | -125,419 | 41 | 86,734 | 58 | 38,685 | 72 |
| Sugar | 765,669 | 12 | 26,065 | 42 | -30,608 | 62 | 4,543 | 13 |
| Soybeans | 583,208 | 2 | 88,901 | 41 | -62,971 | 65 | -25,930 | 27 |
| Gold | 453,540 | 0 | 142,851 | 19 | -154,554 | 83 | 11,703 | 1 |
| Wheat | 320,767 | 14 | -3,426 | 15 | 9,939 | 74 | -6,513 | 77 |
| Heating Oil | 283,749 | 29 | 24,464 | 78 | -36,472 | 32 | 12,008 | 40 |
| Coffee | 209,446 | 13 | 30,453 | 65 | -31,268 | 41 | 815 | 7 |
| Copper | 187,988 | 21 | -28,477 | 22 | 27,700 | 78 | 777 | 30 |
| Brent | 175,896 | 21 | -34,211 | 54 | 32,411 | 47 | 1,800 | 34 |
| Silver | 141,093 | 8 | 2,879 | 9 | -13,574 | 89 | 10,695 | 21 |
| Platinum | 62,782 | 26 | 846 | 9 | -4,055 | 93 | 3,209 | 7 |
| Palladium | 7,619 | 6 | -1,970 | 12 | 2,044 | 86 | -74 | 40 |
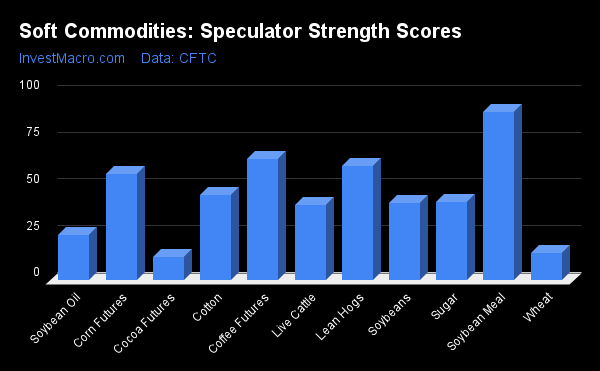
Strength Scores
Strength Scores (a normalized measure of Speculator positions over a 3-Year range, from 0 to 100 where above 80 is extreme bullish and below 20 is extreme bearish) show that Soybean Meal (89.9 percent) leads the soft commodity markets this week and is in a bullish extreme position (above 80 percent). Coffee (65.1 percent) comes in as the next highest soft commodity market in strength scores followed by Lean Hogs (61.4 percent) and Corn (57.0 percent). On the downside, Cocoa (12.2 percent) and Wheat (14.6 percent) come in as the lowest strength scores currently and are both in bearish extreme levels (below 20 percent).
Strength Statistics:
Corn (57.0 percent) vs Corn previous week (55.8 percent)
Sugar (42.0 percent) vs Sugar previous week (43.7 percent)
Coffee (65.1 percent) vs Coffee previous week (62.4 percent)
Soybeans (41.2 percent) vs Soybeans previous week (42.3 percent)
Soybean Oil (24.2 percent) vs Soybean Oil previous week (23.8 percent)
Soybean Meal (89.9 percent) vs Soybean Meal previous week (88.6 percent)
Live Cattle (40.3 percent) vs Live Cattle previous week (25.6 percent)
Lean Hogs (61.4 percent) vs Lean Hogs previous week (50.0 percent)
Cotton (45.7 percent) vs Cotton previous week (46.3 percent)
Cocoa (12.2 percent) vs Cocoa previous week (15.7 percent)
Wheat (14.6 percent) vs Wheat previous week (18.1 percent)
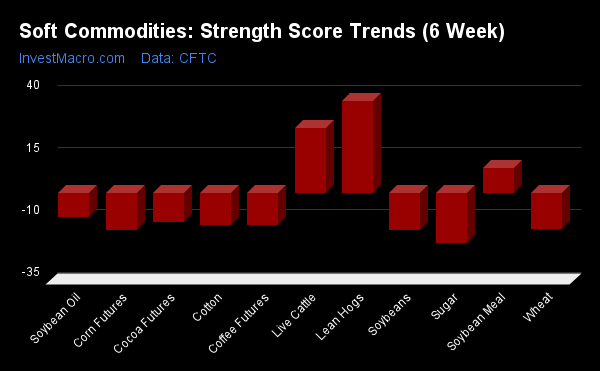
Strength Trends
Strength Score Trends (or move index, calculates the 6-week changes in strength scores) showed that most of the softs markets have cooled off following a strong start to the year. Lean Hogs with a six-week trend score of 36.9 percent leads the trends data for the soft commodity markets this week. Live Cattle (26.0 percent) and Soybean Meal (10.2 percent) follow next and are the only other positive movers in the latest trends data. Sugar (-19.9 percent) leads with the largest downside trend score currently while the next markets with lower trend scores were Corn (-15.0 percent), Soybeans (-14.7 percent) and Wheat (-14.5 percent).
Strength Trend Statistics:
Corn (-15.0 percent) vs Corn previous week (-22.8 percent)
Sugar (-19.9 percent) vs Sugar previous week (-26.4 percent)
Coffee (-12.7 percent) vs Coffee previous week (-19.1 percent)
Soybeans (-14.7 percent) vs Soybeans previous week (-26.1 percent)
Soybean Oil (-9.6 percent) vs Soybean Oil previous week (-25.6 percent)
Soybean Meal (10.2 percent) vs Soybean Meal previous week (8.0 percent)
Live Cattle (26.0 percent) vs Live Cattle previous week (-4.1 percent)
Lean Hogs (36.9 percent) vs Lean Hogs previous week (30.1 percent)
Cotton (-12.9 percent) vs Cotton previous week (-18.4 percent)
Cocoa (-11.7 percent) vs Cocoa previous week (-5.2 percent)
Wheat (-14.5 percent) vs Wheat previous week (-25.8 percent)
Individual Markets:
CORN Futures:
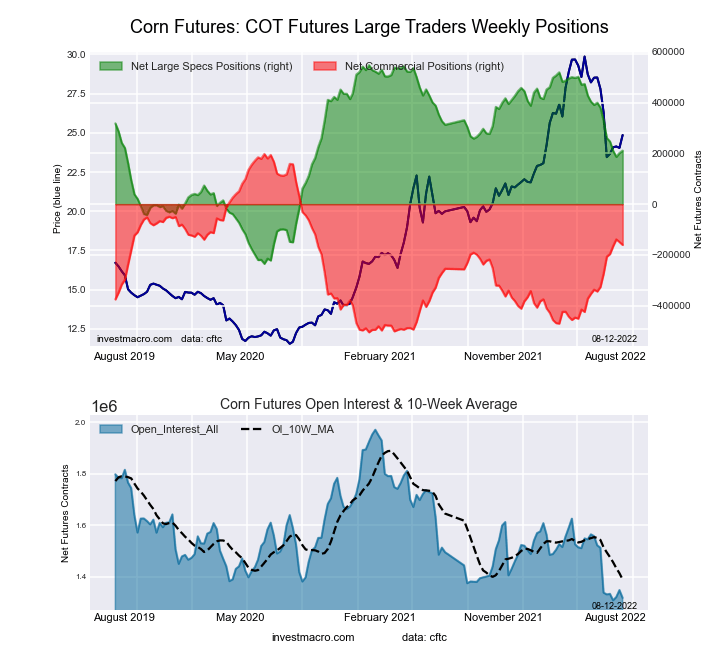
The CORN large speculator standing this week equaled a net position of 210,786 contracts in the data reported through Tuesday. This was a weekly boost of 9,431 contracts from the previous week which had a total of 201,355 net contracts.
This week’s current strength score (the trader positioning range over the past three years, measured from 0 to 100) shows the speculators are currently Bullish with a score of 57.0 percent. The commercials are Bearish with a score of 49.0 percent and the small traders (not shown in chart) are Bearish-Extreme with a score of 14.2 percent.
| CORN Futures Statistics | SPECULATORS | COMMERCIALS | SMALL TRADERS |
| – Percent of Open Interest Longs: | 26.5 | 48.5 | 9.6 |
| – Percent of Open Interest Shorts: | 10.5 | 60.7 | 13.4 |
| – Net Position: | 210,786 | -160,654 | -50,132 |
| – Gross Longs: | 349,498 | 639,748 | 126,594 |
| – Gross Shorts: | 138,712 | 800,402 | 176,726 |
| – Long to Short Ratio: | 2.5 to 1 | 0.8 to 1 | 0.7 to 1 |
| NET POSITION TREND: | |||
| – Strength Index Score (3 Year Range Pct): | 57.0 | 49.0 | 14.2 |
| – Strength Index Reading (3 Year Range): | Bullish | Bearish | Bearish-Extreme |
| NET POSITION MOVEMENT INDEX: | |||
| – 6-Week Change in Strength Index: | -15.0 | 16.1 | 2.2 |
SUGAR Futures:
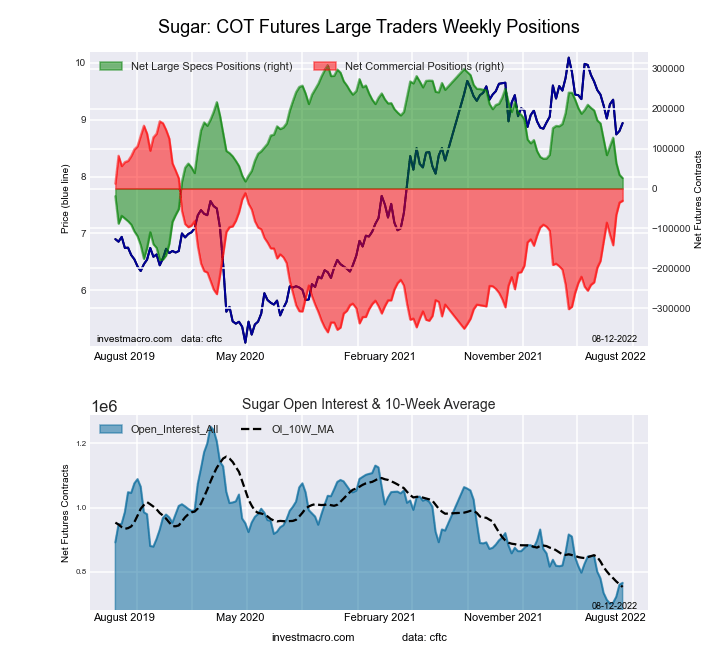
The SUGAR large speculator standing this week equaled a net position of 26,065 contracts in the data reported through Tuesday. This was a weekly lowering of -8,373 contracts from the previous week which had a total of 34,438 net contracts.
This week’s current strength score (the trader positioning range over the past three years, measured from 0 to 100) shows the speculators are currently Bearish with a score of 42.0 percent. The commercials are Bullish with a score of 62.3 percent and the small traders (not shown in chart) are Bearish-Extreme with a score of 13.5 percent.
| SUGAR Futures Statistics | SPECULATORS | COMMERCIALS | SMALL TRADERS |
| – Percent of Open Interest Longs: | 22.7 | 54.3 | 8.9 |
| – Percent of Open Interest Shorts: | 19.3 | 58.3 | 8.3 |
| – Net Position: | 26,065 | -30,608 | 4,543 |
| – Gross Longs: | 174,128 | 416,052 | 68,341 |
| – Gross Shorts: | 148,063 | 446,660 | 63,798 |
| – Long to Short Ratio: | 1.2 to 1 | 0.9 to 1 | 1.1 to 1 |
| NET POSITION TREND: | |||
| – Strength Index Score (3 Year Range Pct): | 42.0 | 62.3 | 13.5 |
| – Strength Index Reading (3 Year Range): | Bearish | Bullish | Bearish-Extreme |
| NET POSITION MOVEMENT INDEX: | |||
| – 6-Week Change in Strength Index: | -19.9 | 19.4 | -7.0 |
COFFEE Futures:
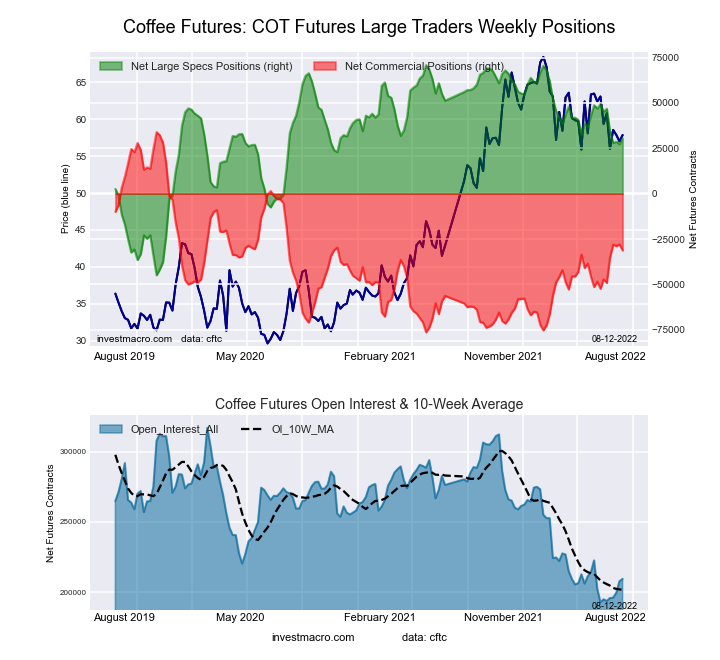
The COFFEE large speculator standing this week equaled a net position of 30,453 contracts in the data reported through Tuesday. This was a weekly increase of 3,169 contracts from the previous week which had a total of 27,284 net contracts.
This week’s current strength score (the trader positioning range over the past three years, measured from 0 to 100) shows the speculators are currently Bullish with a score of 65.1 percent. The commercials are Bearish with a score of 40.9 percent and the small traders (not shown in chart) are Bearish-Extreme with a score of 7.0 percent.
| COFFEE Futures Statistics | SPECULATORS | COMMERCIALS | SMALL TRADERS |
| – Percent of Open Interest Longs: | 22.2 | 54.9 | 4.0 |
| – Percent of Open Interest Shorts: | 7.6 | 69.8 | 3.6 |
| – Net Position: | 30,453 | -31,268 | 815 |
| – Gross Longs: | 46,419 | 114,888 | 8,350 |
| – Gross Shorts: | 15,966 | 146,156 | 7,535 |
| – Long to Short Ratio: | 2.9 to 1 | 0.8 to 1 | 1.1 to 1 |
| NET POSITION TREND: | |||
| – Strength Index Score (3 Year Range Pct): | 65.1 | 40.9 | 7.0 |
| – Strength Index Reading (3 Year Range): | Bullish | Bearish | Bearish-Extreme |
| NET POSITION MOVEMENT INDEX: | |||
| – 6-Week Change in Strength Index: | -12.7 | 14.4 | -10.4 |
SOYBEANS Futures:
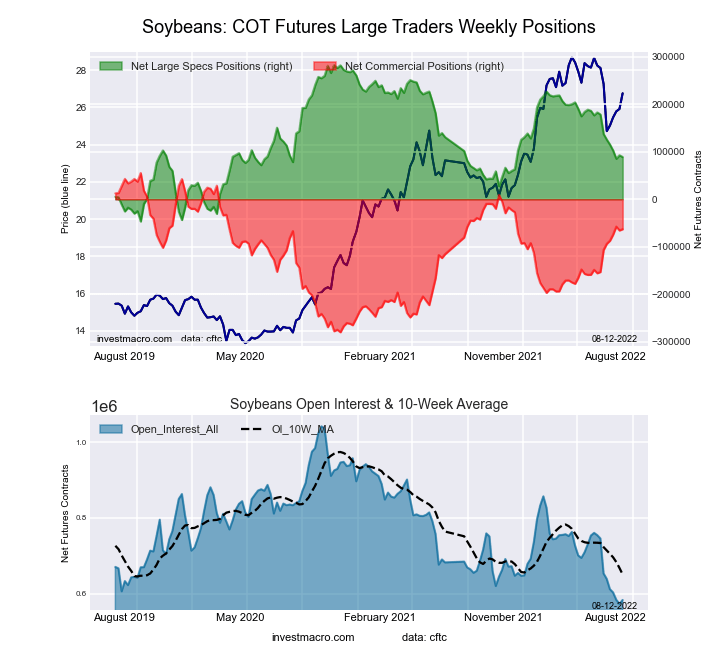
The SOYBEANS large speculator standing this week equaled a net position of 88,901 contracts in the data reported through Tuesday. This was a weekly decline of -3,626 contracts from the previous week which had a total of 92,527 net contracts.
This week’s current strength score (the trader positioning range over the past three years, measured from 0 to 100) shows the speculators are currently Bearish with a score of 41.2 percent. The commercials are Bullish with a score of 64.7 percent and the small traders (not shown in chart) are Bearish with a score of 27.2 percent.
| SOYBEANS Futures Statistics | SPECULATORS | COMMERCIALS | SMALL TRADERS |
| – Percent of Open Interest Longs: | 25.5 | 54.0 | 6.1 |
| – Percent of Open Interest Shorts: | 10.2 | 64.8 | 10.6 |
| – Net Position: | 88,901 | -62,971 | -25,930 |
| – Gross Longs: | 148,533 | 315,133 | 35,744 |
| – Gross Shorts: | 59,632 | 378,104 | 61,674 |
| – Long to Short Ratio: | 2.5 to 1 | 0.8 to 1 | 0.6 to 1 |
| NET POSITION TREND: | |||
| – Strength Index Score (3 Year Range Pct): | 41.2 | 64.7 | 27.2 |
| – Strength Index Reading (3 Year Range): | Bearish | Bullish | Bearish |
| NET POSITION MOVEMENT INDEX: | |||
| – 6-Week Change in Strength Index: | -14.7 | 13.1 | 7.7 |
SOYBEAN OIL Futures:
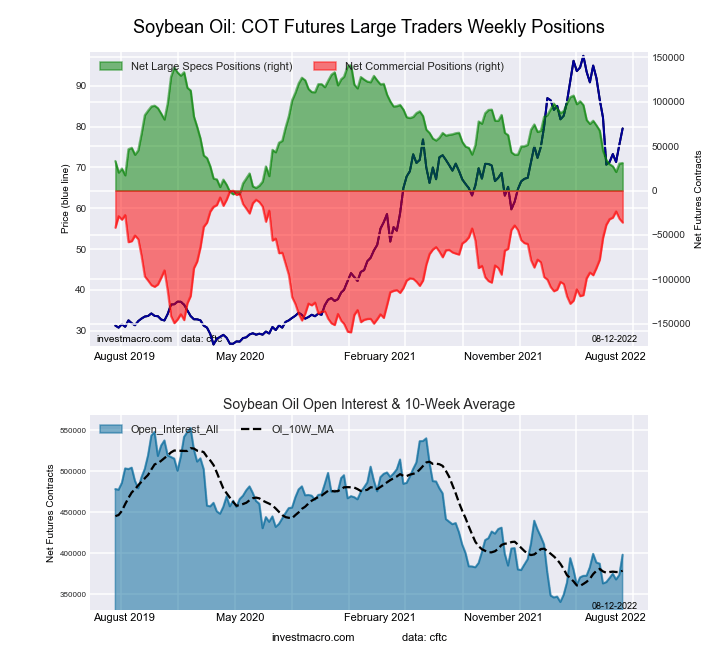
The SOYBEAN OIL large speculator standing this week equaled a net position of 31,007 contracts in the data reported through Tuesday. This was a weekly advance of 626 contracts from the previous week which had a total of 30,381 net contracts.
This week’s current strength score (the trader positioning range over the past three years, measured from 0 to 100) shows the speculators are currently Bearish with a score of 24.2 percent. The commercials are Bullish with a score of 77.5 percent and the small traders (not shown in chart) are Bearish with a score of 32.0 percent.
| SOYBEAN OIL Futures Statistics | SPECULATORS | COMMERCIALS | SMALL TRADERS |
| – Percent of Open Interest Longs: | 17.5 | 56.1 | 6.7 |
| – Percent of Open Interest Shorts: | 9.7 | 65.1 | 5.5 |
| – Net Position: | 31,007 | -35,972 | 4,965 |
| – Gross Longs: | 69,604 | 223,354 | 26,755 |
| – Gross Shorts: | 38,597 | 259,326 | 21,790 |
| – Long to Short Ratio: | 1.8 to 1 | 0.9 to 1 | 1.2 to 1 |
| NET POSITION TREND: | |||
| – Strength Index Score (3 Year Range Pct): | 24.2 | 77.5 | 32.0 |
| – Strength Index Reading (3 Year Range): | Bearish | Bullish | Bearish |
| NET POSITION MOVEMENT INDEX: | |||
| – 6-Week Change in Strength Index: | -9.6 | 10.8 | -12.5 |
SOYBEAN MEAL Futures:
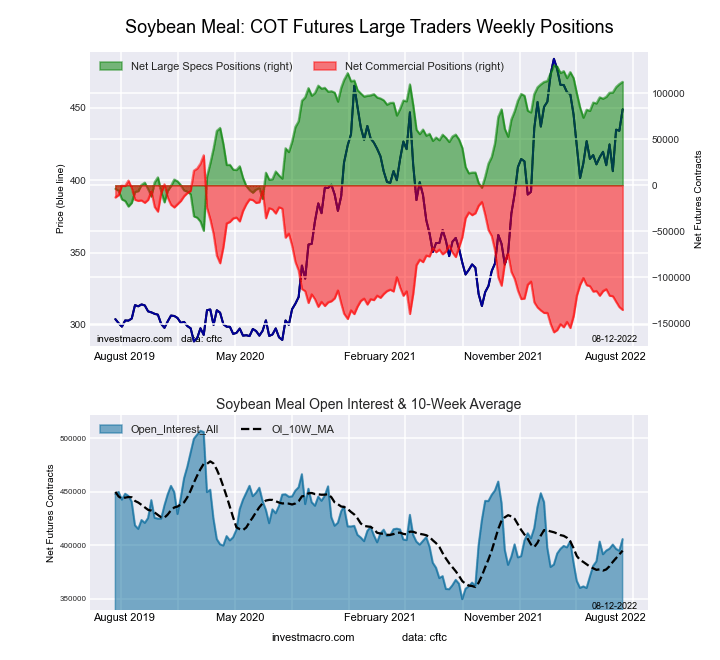
The SOYBEAN MEAL large speculator standing this week equaled a net position of 112,176 contracts in the data reported through Tuesday. This was a weekly increase of 2,400 contracts from the previous week which had a total of 109,776 net contracts.
This week’s current strength score (the trader positioning range over the past three years, measured from 0 to 100) shows the speculators are currently Bullish-Extreme with a score of 89.9 percent. The commercials are Bearish-Extreme with a score of 12.7 percent and the small traders (not shown in chart) are Bullish with a score of 52.2 percent.
| SOYBEAN MEAL Futures Statistics | SPECULATORS | COMMERCIALS | SMALL TRADERS |
| – Percent of Open Interest Longs: | 30.5 | 40.2 | 11.1 |
| – Percent of Open Interest Shorts: | 2.8 | 73.5 | 5.5 |
| – Net Position: | 112,176 | -135,196 | 23,020 |
| – Gross Longs: | 123,666 | 163,088 | 45,224 |
| – Gross Shorts: | 11,490 | 298,284 | 22,204 |
| – Long to Short Ratio: | 10.8 to 1 | 0.5 to 1 | 2.0 to 1 |
| NET POSITION TREND: | |||
| – Strength Index Score (3 Year Range Pct): | 89.9 | 12.7 | 52.2 |
| – Strength Index Reading (3 Year Range): | Bullish-Extreme | Bearish-Extreme | Bullish |
| NET POSITION MOVEMENT INDEX: | |||
| – 6-Week Change in Strength Index: | 10.2 | -10.6 | 10.7 |
LIVE CATTLE Futures:
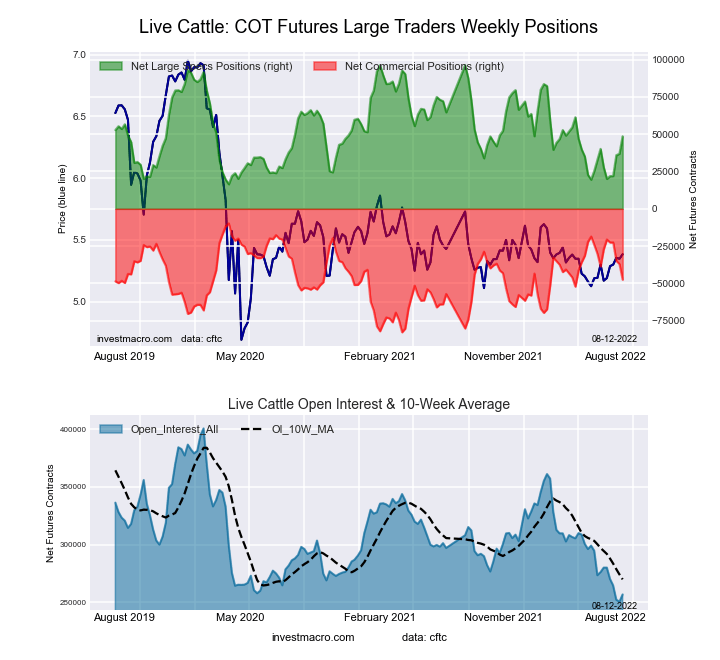
The LIVE CATTLE large speculator standing this week equaled a net position of 48,582 contracts in the data reported through Tuesday. This was a weekly rise of 11,693 contracts from the previous week which had a total of 36,889 net contracts.
This week’s current strength score (the trader positioning range over the past three years, measured from 0 to 100) shows the speculators are currently Bearish with a score of 40.3 percent. The commercials are Bearish with a score of 48.3 percent and the small traders (not shown in chart) are Bullish with a score of 77.9 percent.
| LIVE CATTLE Futures Statistics | SPECULATORS | COMMERCIALS | SMALL TRADERS |
| – Percent of Open Interest Longs: | 37.4 | 37.5 | 12.5 |
| – Percent of Open Interest Shorts: | 18.5 | 56.0 | 12.9 |
| – Net Position: | 48,582 | -47,453 | -1,129 |
| – Gross Longs: | 96,027 | 96,302 | 32,141 |
| – Gross Shorts: | 47,445 | 143,755 | 33,270 |
| – Long to Short Ratio: | 2.0 to 1 | 0.7 to 1 | 1.0 to 1 |
| NET POSITION TREND: | |||
| – Strength Index Score (3 Year Range Pct): | 40.3 | 48.3 | 77.9 |
| – Strength Index Reading (3 Year Range): | Bearish | Bearish | Bullish |
| NET POSITION MOVEMENT INDEX: | |||
| – 6-Week Change in Strength Index: | 26.0 | -27.9 | -1.3 |
LEAN HOGS Futures:
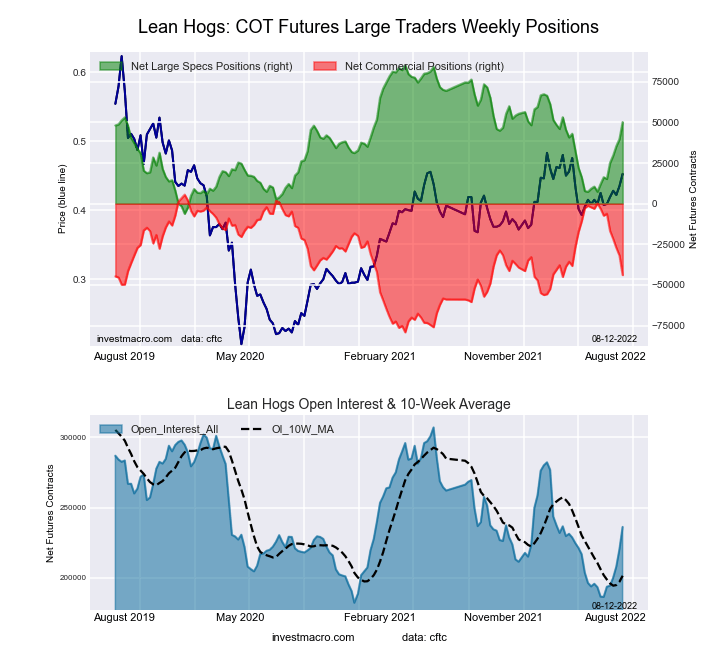
The LEAN HOGS large speculator standing this week equaled a net position of 50,197 contracts in the data reported through Tuesday. This was a weekly boost of 10,480 contracts from the previous week which had a total of 39,717 net contracts.
This week’s current strength score (the trader positioning range over the past three years, measured from 0 to 100) shows the speculators are currently Bullish with a score of 61.4 percent. The commercials are Bearish with a score of 41.6 percent and the small traders (not shown in chart) are Bullish with a score of 63.8 percent.
| LEAN HOGS Futures Statistics | SPECULATORS | COMMERCIALS | SMALL TRADERS |
| – Percent of Open Interest Longs: | 40.5 | 32.2 | 9.8 |
| – Percent of Open Interest Shorts: | 19.2 | 50.8 | 12.5 |
| – Net Position: | 50,197 | -43,894 | -6,303 |
| – Gross Longs: | 95,556 | 76,050 | 23,171 |
| – Gross Shorts: | 45,359 | 119,944 | 29,474 |
| – Long to Short Ratio: | 2.1 to 1 | 0.6 to 1 | 0.8 to 1 |
| NET POSITION TREND: | |||
| – Strength Index Score (3 Year Range Pct): | 61.4 | 41.6 | 63.8 |
| – Strength Index Reading (3 Year Range): | Bullish | Bearish | Bullish |
| NET POSITION MOVEMENT INDEX: | |||
| – 6-Week Change in Strength Index: | 36.9 | -43.2 | 13.7 |
COTTON Futures:
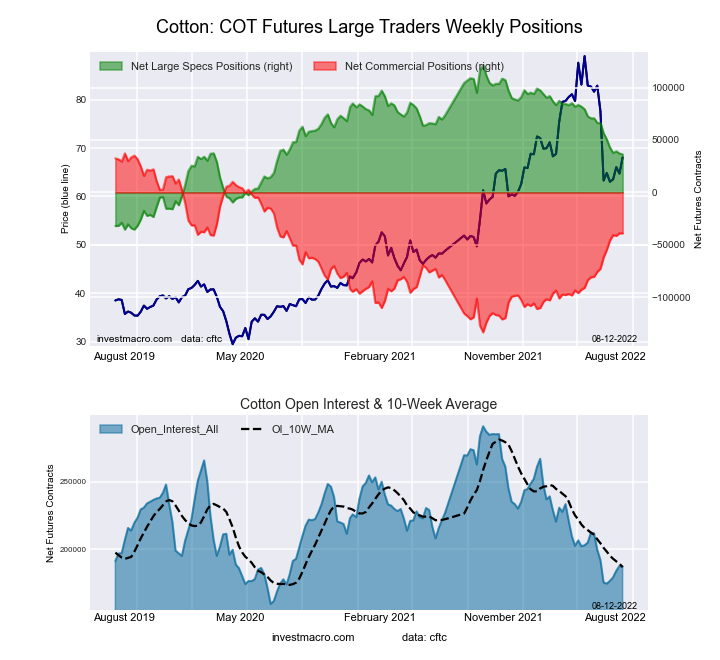
The COTTON large speculator standing this week equaled a net position of 36,223 contracts in the data reported through Tuesday. This was a weekly decline of -940 contracts from the previous week which had a total of 37,163 net contracts.
This week’s current strength score (the trader positioning range over the past three years, measured from 0 to 100) shows the speculators are currently Bearish with a score of 45.7 percent. The commercials are Bullish with a score of 56.0 percent and the small traders (not shown in chart) are Bearish with a score of 28.3 percent.
| COTTON Futures Statistics | SPECULATORS | COMMERCIALS | SMALL TRADERS |
| – Percent of Open Interest Longs: | 35.9 | 46.6 | 6.5 |
| – Percent of Open Interest Shorts: | 16.5 | 67.4 | 5.0 |
| – Net Position: | 36,223 | -39,006 | 2,783 |
| – Gross Longs: | 67,046 | 87,092 | 12,137 |
| – Gross Shorts: | 30,823 | 126,098 | 9,354 |
| – Long to Short Ratio: | 2.2 to 1 | 0.7 to 1 | 1.3 to 1 |
| NET POSITION TREND: | |||
| – Strength Index Score (3 Year Range Pct): | 45.7 | 56.0 | 28.3 |
| – Strength Index Reading (3 Year Range): | Bearish | Bullish | Bearish |
| NET POSITION MOVEMENT INDEX: | |||
| – 6-Week Change in Strength Index: | -12.9 | 13.6 | -17.4 |
COCOA Futures:
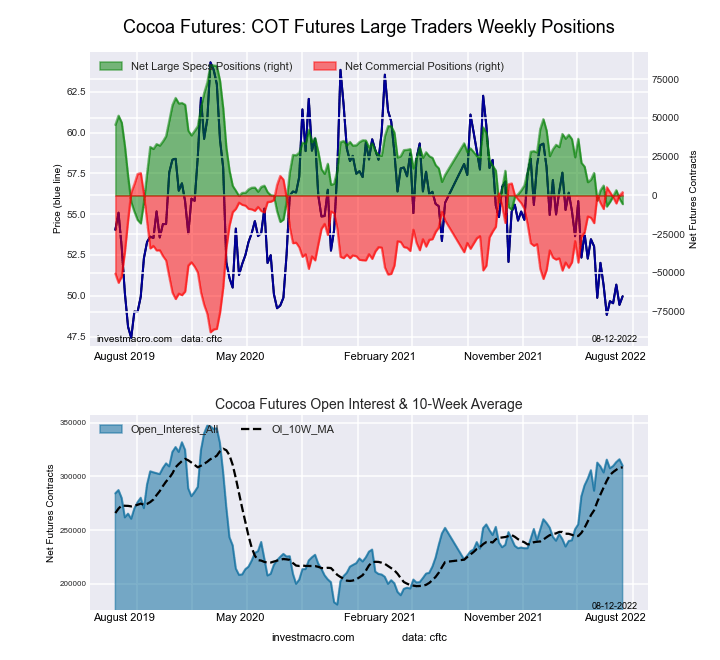
The COCOA large speculator standing this week equaled a net position of -5,562 contracts in the data reported through Tuesday. This was a weekly reduction of -3,605 contracts from the previous week which had a total of -1,957 net contracts.
This week’s current strength score (the trader positioning range over the past three years, measured from 0 to 100) shows the speculators are currently Bearish-Extreme with a score of 12.2 percent. The commercials are Bullish-Extreme with a score of 88.0 percent and the small traders (not shown in chart) are Bearish with a score of 30.6 percent.
| COCOA Futures Statistics | SPECULATORS | COMMERCIALS | SMALL TRADERS |
| – Percent of Open Interest Longs: | 29.9 | 47.3 | 4.8 |
| – Percent of Open Interest Shorts: | 31.7 | 46.6 | 3.7 |
| – Net Position: | -5,562 | 2,152 | 3,410 |
| – Gross Longs: | 92,797 | 146,523 | 14,847 |
| – Gross Shorts: | 98,359 | 144,371 | 11,437 |
| – Long to Short Ratio: | 0.9 to 1 | 1.0 to 1 | 1.3 to 1 |
| NET POSITION TREND: | |||
| – Strength Index Score (3 Year Range Pct): | 12.2 | 88.0 | 30.6 |
| – Strength Index Reading (3 Year Range): | Bearish-Extreme | Bullish-Extreme | Bearish |
| NET POSITION MOVEMENT INDEX: | |||
| – 6-Week Change in Strength Index: | -11.7 | 10.6 | 10.4 |
WHEAT Futures:
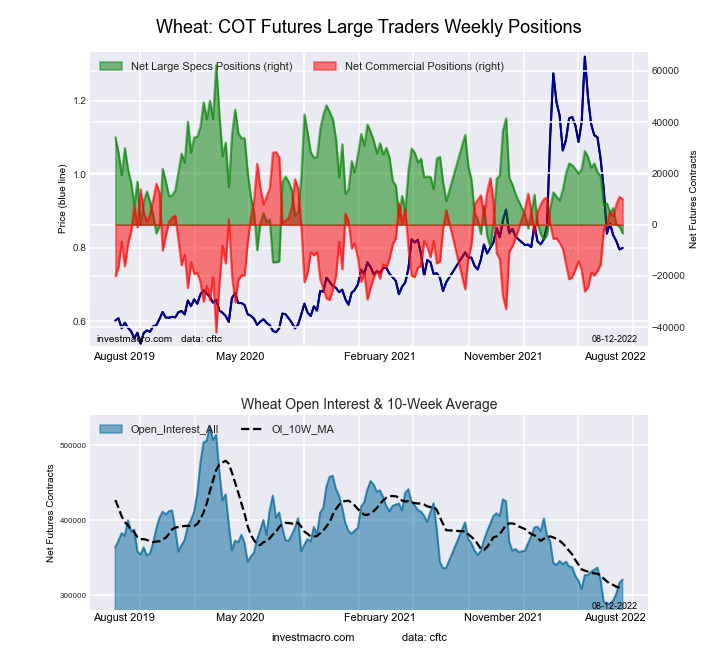
The WHEAT large speculator standing this week equaled a net position of -3,426 contracts in the data reported through Tuesday. This was a weekly fall of -2,701 contracts from the previous week which had a total of -725 net contracts.
This week’s current strength score (the trader positioning range over the past three years, measured from 0 to 100) shows the speculators are currently Bearish-Extreme with a score of 14.6 percent. The commercials are Bullish with a score of 73.8 percent and the small traders (not shown in chart) are Bullish with a score of 76.6 percent.
| WHEAT Futures Statistics | SPECULATORS | COMMERCIALS | SMALL TRADERS |
| – Percent of Open Interest Longs: | 29.9 | 39.2 | 9.7 |
| – Percent of Open Interest Shorts: | 31.0 | 36.1 | 11.8 |
| – Net Position: | -3,426 | 9,939 | -6,513 |
| – Gross Longs: | 96,022 | 125,605 | 31,241 |
| – Gross Shorts: | 99,448 | 115,666 | 37,754 |
| – Long to Short Ratio: | 1.0 to 1 | 1.1 to 1 | 0.8 to 1 |
| NET POSITION TREND: | |||
| – Strength Index Score (3 Year Range Pct): | 14.6 | 73.8 | 76.6 |
| – Strength Index Reading (3 Year Range): | Bearish-Extreme | Bullish | Bullish |
| NET POSITION MOVEMENT INDEX: | |||
| – 6-Week Change in Strength Index: | -14.5 | 16.8 | -3.7 |
*COT Report: The COT data, released weekly to the public each Friday, is updated through the most recent Tuesday (data is 3 days old) and shows a quick view of how large speculators or non-commercials (for-profit traders) were positioned in the futures markets.
The CFTC categorizes trader positions according to commercial hedgers (traders who use futures contracts for hedging as part of the business), non-commercials (large traders who speculate to realize trading profits) and nonreportable traders (usually small traders/speculators) as well as their open interest (contracts open in the market at time of reporting).See CFTC criteria here.
More By This Author:
Currency Speculators Trim Japanese Yen Bearish Bets While Brazilian Real Bets Fall To Bearish Level
COT Week 31 Charts: Soft Commodities Speculator Bets Rose Higher This Week Led By Corn & Soybean Oil
Bonds Speculators Bets Drop This Week Led By Fed Funds, Eurodollar & 10-Year Bond
Disclosure: Foreign Currency trading and trading on margin carries a high level of risk and can result in loss of part or all of your investment.Due to the level of risk and market volatility, ...
more

