Published
1 year ago on
August 10, 2022
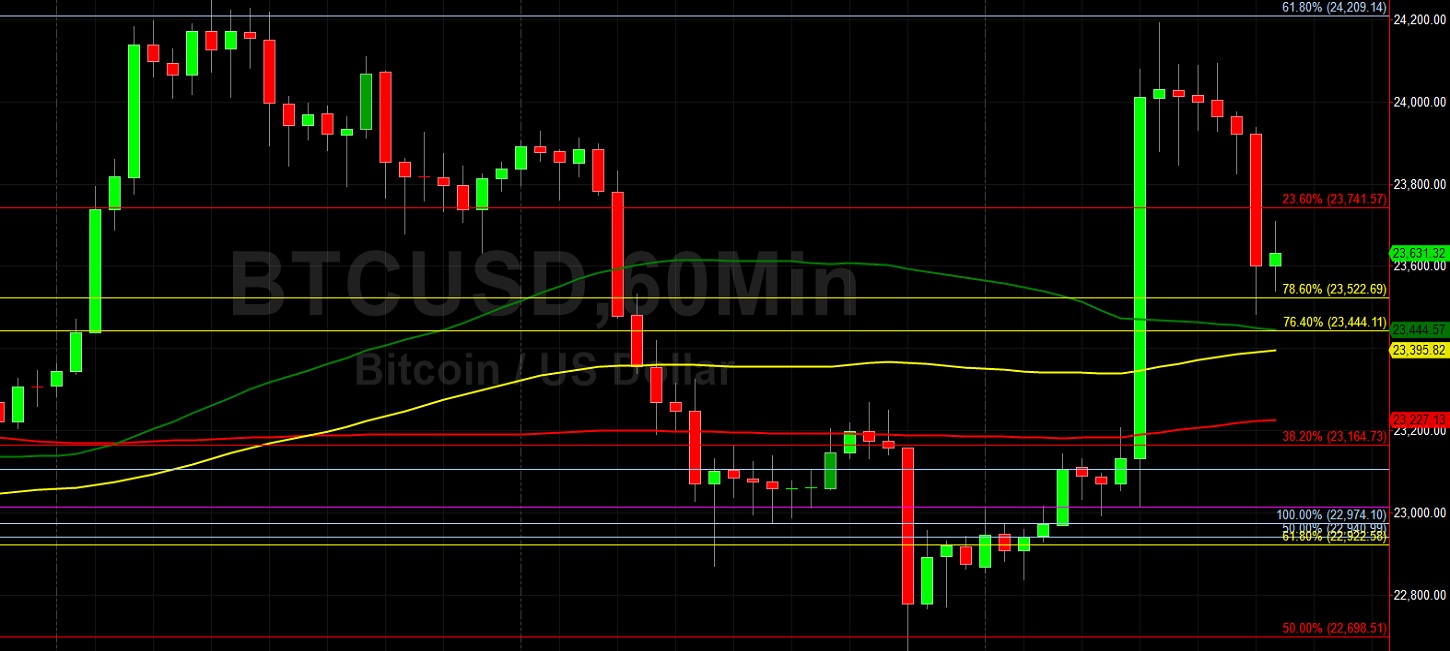
Bitcoin (BTC/USD) awaited fresh technical clues early in the Asian session as the pair continued to orbit the 23185.97 level, an upside price objective related to buying pressure that emerged around the 17567.45 and 20715 areas. Bulls are looking for a sustained break above the 23522.69 area, a level that represents the 78.6% retracement of the depreciating range from 24287.13 to 20715. BTC/USD has traded sideways since the beginning of August following July’s 15.3% gain and a 66.7% pullback through the end of July. The recent move higher to the 24666 area was a test of the 24558.33 level, representing the 50% retracement of the depreciating range from 31549.21 to 17567.45.
Additional upside retracement levels in this depreciating range include the 26208, 28249, and 28557 areas. Additional upside price objectives and areas of potential selling pressures include the 25552, 26323, 26411, 26901, 27126, 27455, 28426, and 29669 areas. Below recent price activity, possible technical support and areas of buying pressure include the, 22582, 22141, 21596, 20446, 19852, and 19762 levels. Additional significant technical areas on the downside include the 16990.14, 14500.15, and 10432.73 areas. Traders are observing that the 50-bar MA (4-hourly) is bullishly indicating above the 100-bar MA (4-hourly) and above the 200-bar MA (4-hourly). Also, the 50-bar MA (hourly) is bearishly indicating below the 200-bar MA (hourly) and above the 100-bar MA (hourly).
Price activity is nearest the 50-bar MA (4-hourly) at 23141.79 and the 200-bar MA (Hourly) at 23263.47.
Technical Support is expected around 16990.14/ 14500.15/ 10432.73 with Stops expected below.
Technical Resistance is expected around 25256.96/ 27455.20/ 32383.96 with Stops expected above.
On 4-Hourly chart, SlowK is Bullishly above SlowD while MACD is Bullishly above MACDAverage.
On 60-minute chart, SlowK is Bearishly below SlowD while MACD is Bullishly above MACDAverage.
Disclaimer: This trading analysis is provided by a third party, and for informational purposes only. It does not reflect the views of Crypto Daily, nor is it intended to be used as legal, tax, investment, or financial advice.
Investment DisclaimerBitcoin suffering down week - macro picture uncertain
Bitcoin & Ethereum ETFs Set to Debut in Hong Kong on April 30th