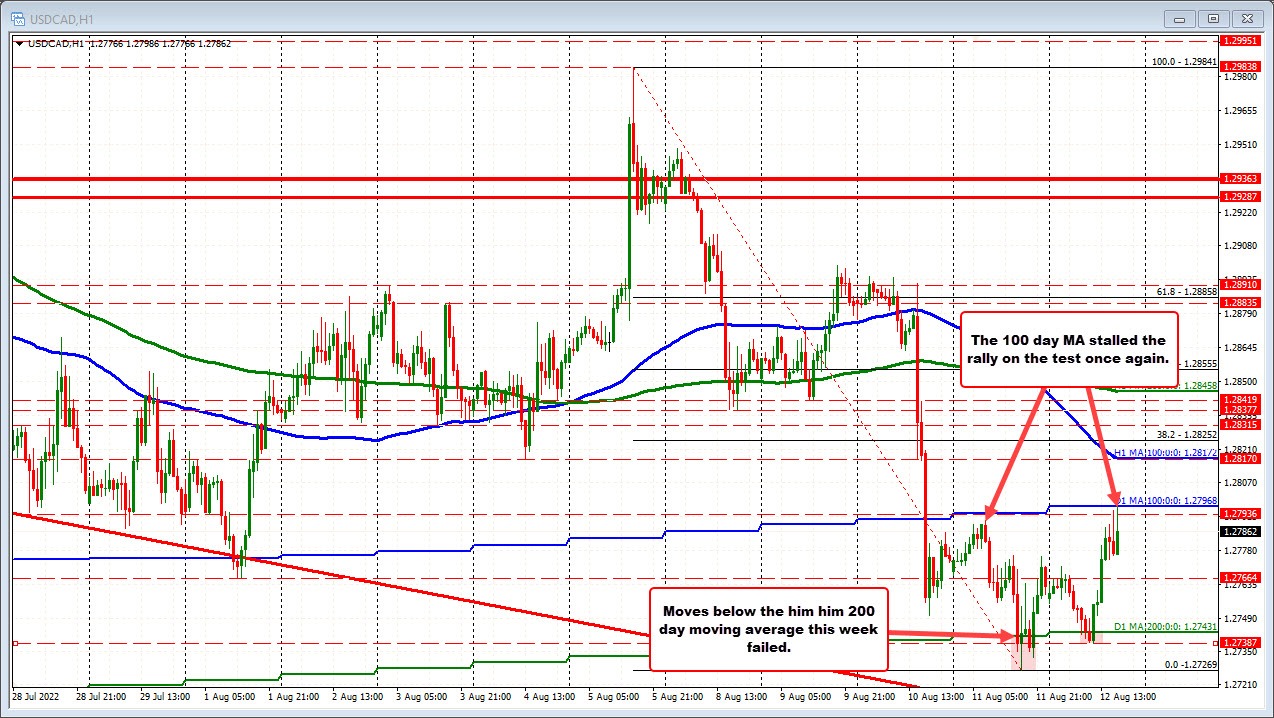
The USDCAD has to a new session high and in the process is retesting its broken at 100 day moving average near 1.27968. The high price just reached 1.27986, just above the moving average level
Recall on Wednesday, the price fell below that moving average and stayed below since that break. However the lows for the week which saw the price dip below the 200 day moving average currently at 1.2743, could not be sustained. Yesterday, the low reached 1.27269. Today the low came in at 1.27387 before bouncing back to the upside.
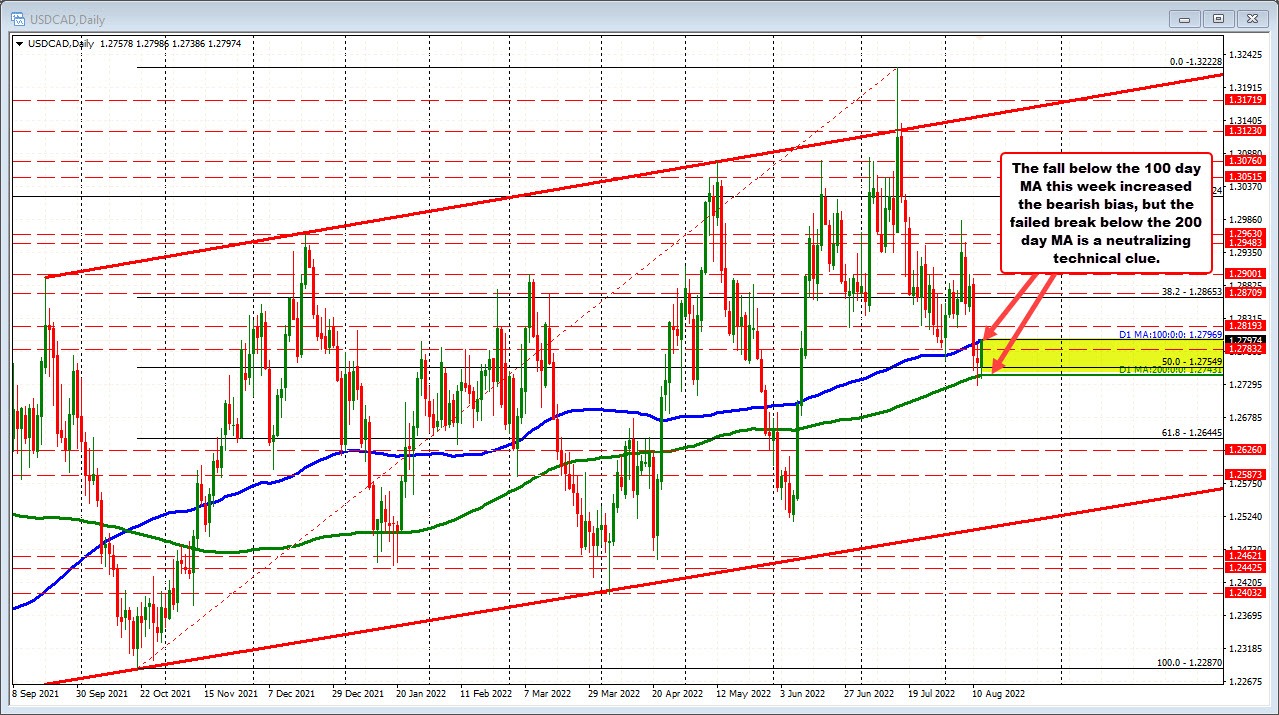
The chart below shows the 100 and 200 day MA on the daily chart. The 50% of the move up from the October 2021 low is also in the area. Traders will watch for the next shove outside the area. What we do know is the price is lower on the week. The dip below the 100 day MA increased the bearish bias but the failure below the 200 day MA neutralizes the technical bias.