
Energy Speculators Bets Fall Led By WTI Crude Oil, Gasoline & Brent
Here are the latest charts and statistics for the Commitment of Traders (COT) data published by the Commodities Futures Trading Commission (CFTC).
The latest COT data is updated through Tuesday August 9nd and shows a quick view of how large traders (for-profit speculators and commercial entities) were positioned in the futures markets.
Weekly Speculator Changes
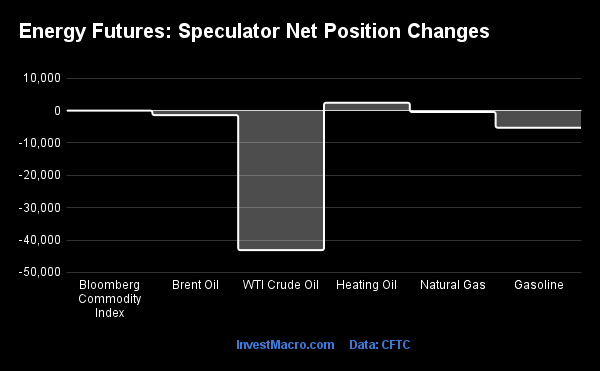
COT energy market speculator bets were lower this week as just one out of the six energy markets we cover had higher positioning this week while the other five markets had lower contracts.
Leading the gains for energy markets was Heating Oil (2,396 contracts) which was the only market this week showing increasing speculator bets.
The energy markets leading the declines in speculator bets this week were WTI Crude Oil (-43,101 contracts) and Gasoline (-5,312 contracts) with Brent Crude Oil (-1,429 contracts), Natural Gas (-446 contracts) and the Bloomberg Commodity Index (-33 contracts) also registering lower bets on the week.
Data Snapshot of Commodity Market Traders
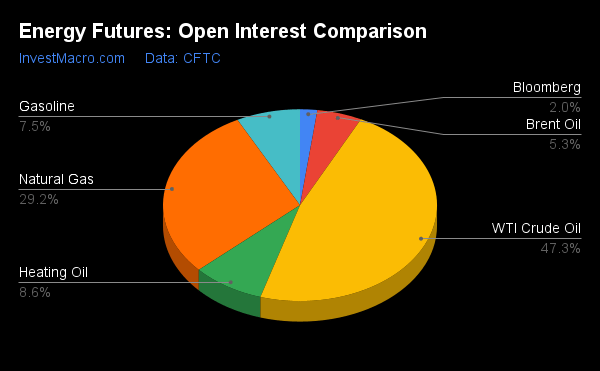
| WTI Crude | 1,570,131 | 0 | 210,651 | 0 | -238,073 | 100 | 27,422 | 53 |
| Corn | 1,317,913 | 1 | 210,786 | 57 | -160,654 | 49 | -50,132 | 14 |
| Natural Gas | 969,582 | 3 | -125,419 | 41 | 86,734 | 58 | 38,685 | 72 |
| Sugar | 765,669 | 12 | 26,065 | 42 | -30,608 | 62 | 4,543 | 13 |
| Soybeans | 583,208 | 2 | 88,901 | 41 | -62,971 | 65 | -25,930 | 27 |
| Gold | 453,540 | 0 | 142,851 | 19 | -154,554 | 83 | 11,703 | 1 |
| Wheat | 320,767 | 14 | -3,426 | 15 | 9,939 | 74 | -6,513 | 77 |
| Heating Oil | 283,749 | 29 | 24,464 | 78 | -36,472 | 32 | 12,008 | 40 |
| Coffee | 209,446 | 13 | 30,453 | 65 | -31,268 | 41 | 815 | 7 |
| Copper | 187,988 | 21 | -28,477 | 22 | 27,700 | 78 | 777 | 30 |
| Brent | 175,896 | 21 | -34,211 | 54 | 32,411 | 47 | 1,800 | 34 |
| Silver | 141,093 | 8 | 2,879 | 9 | -13,574 | 89 | 10,695 | 21 |
| Platinum | 62,782 | 26 | 846 | 9 | -4,055 | 93 | 3,209 | 7 |
| Palladium | 7,619 | 6 | -1,970 | 12 | 2,044 | 86 | -74 | 40 |
Strength Scores
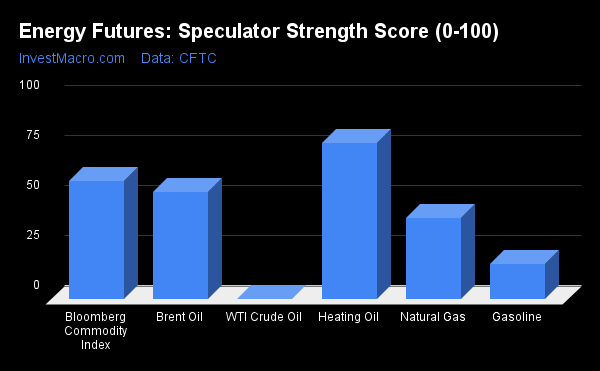
Strength Scores (a normalized measure of Speculator positions over a 3-Year range, from 0 to 100 where above 80 is extreme bullish and below 20 is extreme bearish) showed that Heating Oil (78.4 percent) remains the leader in energy market strength scores. The Bloomberg Commodity Index (59.1 percent) and Brent Crude Oil (53.8 percent) come in as the next highest energy markets in strength scores and both are above 50 percent or the midpoint of their 3-year ranges. On the downside, WTI Crude Oil (0.0 percent) comes in at the lowest strength level currently and is at the bottom of its 3-year range. Joining WTI in a bearish extreme position (below 20 percent) is Gasoline at a 17.5 percent score.
Strength Statistics:
WTI Crude Oil (0.0 percent) vs WTI Crude Oil previous week (11.4 percent)
Brent Crude Oil (53.8 percent) vs Brent Crude Oil previous week (56.2 percent)
Natural Gas (40.9 percent) vs Natural Gas previous week (41.1 percent)
Gasoline (17.5 percent) vs Gasoline previous week (22.9 percent)
Heating Oil (78.4 percent) vs Heating Oil previous week (74.9 percent)
Bloomberg Commodity Index (59.1 percent) vs Bloomberg Commodity Index previous week (59.2 percent)
Strength Trends
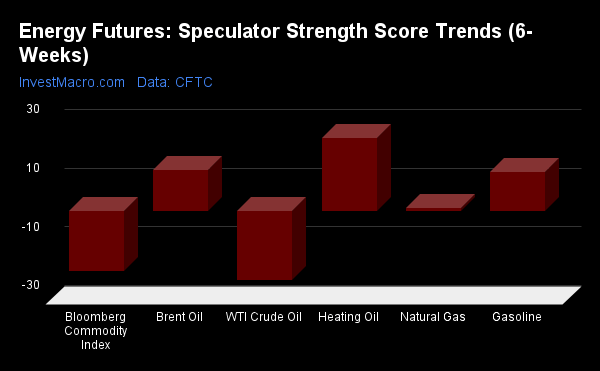
Strength Score Trends (or move index, calculates the 6-week changes in strength scores) show that Heating Oil (24.9 percent) leads the past six weeks trends for energy this week. Brent Crude Oil (14.2 percent) and Gasoline (13.4 percent) fill out the next top movers in the latest trends data. WTI Crude Oil (-23.5 percent) leads the downside trend scores currently while the next market with lower trend scores is the Bloomberg Commodity Index (-20.3 percent).
Strength Trend Statistics:
WTI Crude Oil (-23.5 percent) vs WTI Crude Oil previous week (-9.4 percent)
Brent Crude Oil (14.2 percent) vs Brent Crude Oil previous week (8.8 percent)
Natural Gas (1.2 percent) vs Natural Gas previous week (1.8 percent)
Gasoline (13.4 percent) vs Gasoline previous week (19.5 percent)
Heating Oil (24.9 percent) vs Heating Oil previous week (18.4 percent)
Bloomberg Commodity Index (-20.3 percent) vs Bloomberg Commodity Index previous week (-17.5 percent)
Individual Markets:
WTI Crude Oil Futures:
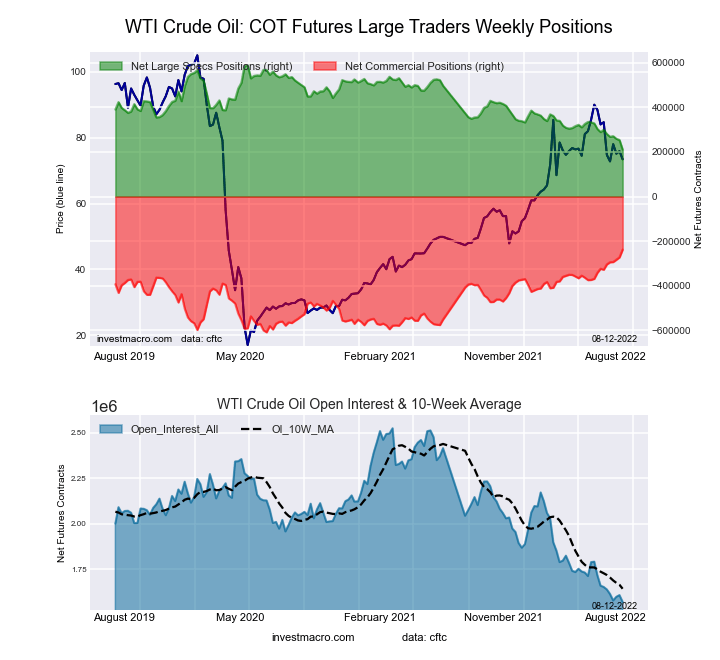
The WTI Crude Oil Futures large speculator standing this week equaled a net position of 210,651 contracts in the data reported through Tuesday. This was a weekly decline of -43,101 contracts from the previous week which had a total of 253,752 net contracts.
This week’s current strength score (the trader positioning range over the past three years, measured from 0 to 100) shows the speculators are currently Bearish-Extreme with a score of 0.0 percent. The commercials are Bullish-Extreme with a score of 100.0 percent and the small traders (not shown in chart) are Bullish with a score of 52.7 percent.
| WTI Crude Oil Futures Statistics | SPECULATORS | COMMERCIALS | SMALL TRADERS |
| – Percent of Open Interest Longs: | 21.5 | 40.6 | 4.9 |
| – Percent of Open Interest Shorts: | 8.1 | 55.7 | 3.2 |
| – Net Position: | 210,651 | -238,073 | 27,422 |
| – Gross Longs: | 338,172 | 636,980 | 76,995 |
| – Gross Shorts: | 127,521 | 875,053 | 49,573 |
| – Long to Short Ratio: | 2.7 to 1 | 0.7 to 1 | 1.6 to 1 |
| NET POSITION TREND: | |||
| – Strength Index Score (3 Year Range Pct): | 0.0 | 100.0 | 52.7 |
| – Strength Index Reading (3 Year Range): | Bearish-Extreme | Bullish-Extreme | Bullish |
| NET POSITION MOVEMENT INDEX: | |||
| – 6-Week Change in Strength Index: | -23.5 | 24.3 | -1.2 |
Brent Crude Oil Futures:
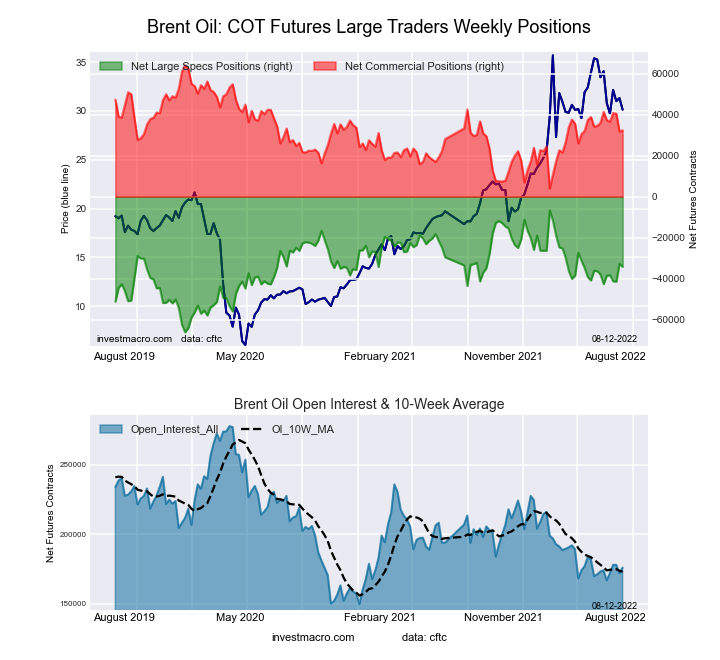
The Brent Crude Oil Futures large speculator standing this week equaled a net position of -34,211 contracts in the data reported through Tuesday. This was a weekly fall of -1,429 contracts from the previous week which had a total of -32,782 net contracts.
This week’s current strength score (the trader positioning range over the past three years, measured from 0 to 100) shows the speculators are currently Bullish with a score of 53.8 percent. The commercials are Bearish with a score of 47.2 percent and the small traders (not shown in chart) are Bearish with a score of 33.6 percent.
| Brent Crude Oil Futures Statistics | SPECULATORS | COMMERCIALS | SMALL TRADERS |
| – Percent of Open Interest Longs: | 18.0 | 49.9 | 3.9 |
| – Percent of Open Interest Shorts: | 37.4 | 31.5 | 2.9 |
| – Net Position: | -34,211 | 32,411 | 1,800 |
| – Gross Longs: | 31,578 | 87,846 | 6,819 |
| – Gross Shorts: | 65,789 | 55,435 | 5,019 |
| – Long to Short Ratio: | 0.5 to 1 | 1.6 to 1 | 1.4 to 1 |
| NET POSITION TREND: | |||
| – Strength Index Score (3 Year Range Pct): | 53.8 | 47.2 | 33.6 |
| – Strength Index Reading (3 Year Range): | Bullish | Bearish | Bearish |
| NET POSITION MOVEMENT INDEX: | |||
| – 6-Week Change in Strength Index: | 14.2 | -15.0 | 7.5 |
Natural Gas Futures:
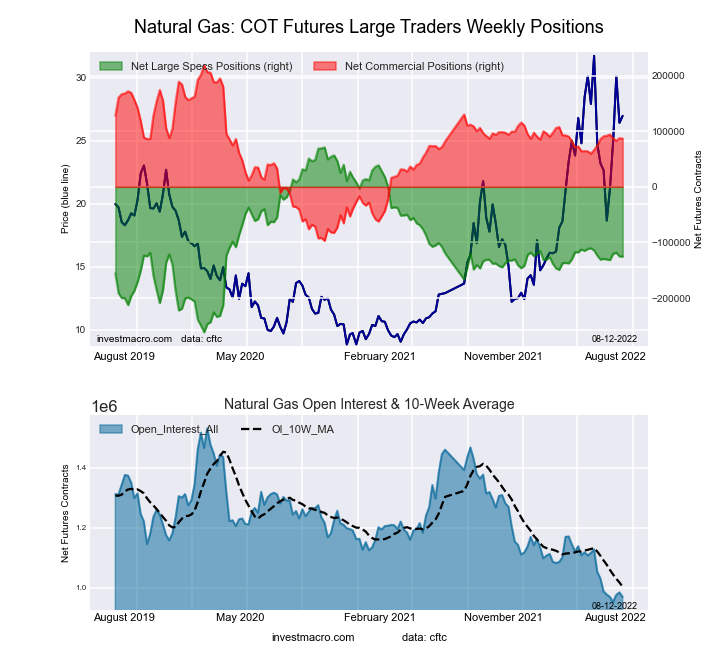
The Natural Gas Futures large speculator standing this week equaled a net position of -125,419 contracts in the data reported through Tuesday. This was a weekly decrease of -446 contracts from the previous week which had a total of -124,973 net contracts.
This week’s current strength score (the trader positioning range over the past three years, measured from 0 to 100) shows the speculators are currently Bearish with a score of 40.9 percent. The commercials are Bullish with a score of 58.2 percent and the small traders (not shown in chart) are Bullish with a score of 71.7 percent.
| Natural Gas Futures Statistics | SPECULATORS | COMMERCIALS | SMALL TRADERS |
| – Percent of Open Interest Longs: | 17.5 | 41.7 | 7.0 |
| – Percent of Open Interest Shorts: | 30.5 | 32.7 | 3.0 |
| – Net Position: | -125,419 | 86,734 | 38,685 |
| – Gross Longs: | 169,972 | 404,077 | 67,512 |
| – Gross Shorts: | 295,391 | 317,343 | 28,827 |
| – Long to Short Ratio: | 0.6 to 1 | 1.3 to 1 | 2.3 to 1 |
| NET POSITION TREND: | |||
| – Strength Index Score (3 Year Range Pct): | 40.9 | 58.2 | 71.7 |
| – Strength Index Reading (3 Year Range): | Bearish | Bullish | Bullish |
| NET POSITION MOVEMENT INDEX: | |||
| – 6-Week Change in Strength Index: | 1.2 | -1.3 | 0.2 |
Gasoline Blendstock Futures:
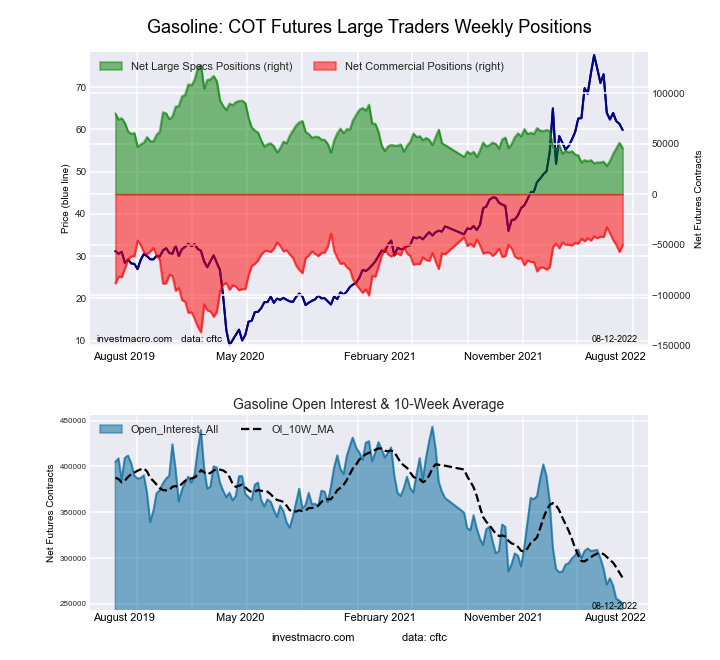
The Gasoline Blendstock Futures large speculator standing this week equaled a net position of 45,506 contracts in the data reported through Tuesday. This was a weekly lowering of -5,312 contracts from the previous week which had a total of 50,818 net contracts.
This week’s current strength score (the trader positioning range over the past three years, measured from 0 to 100) shows the speculators are currently Bearish-Extreme with a score of 17.5 percent. The commercials are Bullish-Extreme with a score of 83.1 percent and the small traders (not shown in chart) are Bearish with a score of 44.4 percent.
| Nasdaq Mini Futures Statistics | SPECULATORS | COMMERCIALS | SMALL TRADERS |
| – Percent of Open Interest Longs: | 29.8 | 48.8 | 7.6 |
| – Percent of Open Interest Shorts: | 11.6 | 68.8 | 5.7 |
| – Net Position: | 45,506 | -50,254 | 4,748 |
| – Gross Longs: | 74,516 | 122,093 | 18,926 |
| – Gross Shorts: | 29,010 | 172,347 | 14,178 |
| – Long to Short Ratio: | 2.6 to 1 | 0.7 to 1 | 1.3 to 1 |
| NET POSITION TREND: | |||
| – Strength Index Score (3 Year Range Pct): | 17.5 | 83.1 | 44.4 |
| – Strength Index Reading (3 Year Range): | Bearish-Extreme | Bullish-Extreme | Bearish |
| NET POSITION MOVEMENT INDEX: | |||
| – 6-Week Change in Strength Index: | 13.4 | -7.5 | -37.3 |
#2 Heating Oil NY-Harbor Futures:
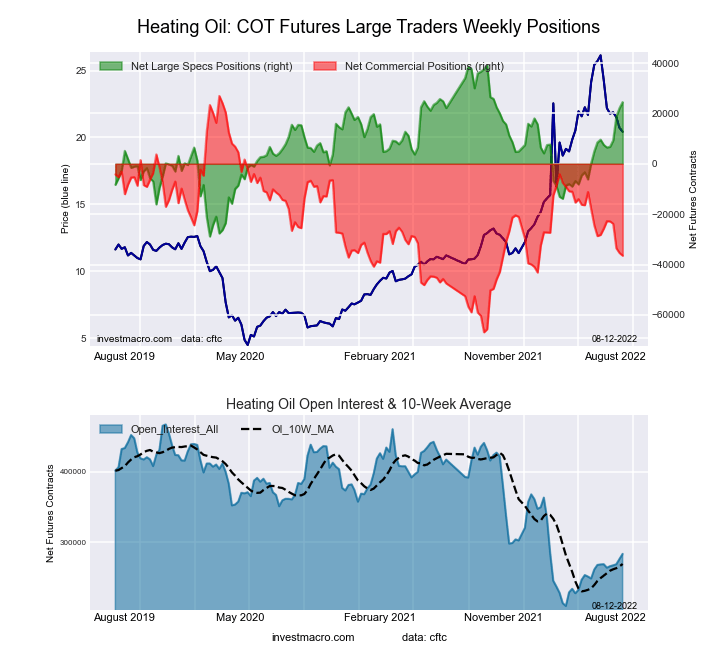
The #2 Heating Oil NY-Harbor Futures large speculator standing this week equaled a net position of 24,464 contracts in the data reported through Tuesday. This was a weekly gain of 2,396 contracts from the previous week which had a total of 22,068 net contracts.
This week’s current strength score (the trader positioning range over the past three years, measured from 0 to 100) shows the speculators are currently Bullish with a score of 78.4 percent. The commercials are Bearish with a score of 32.4 percent and the small traders (not shown in chart) are Bearish with a score of 39.9 percent.
| Heating Oil Futures Statistics | SPECULATORS | COMMERCIALS | SMALL TRADERS |
| – Percent of Open Interest Longs: | 16.1 | 52.6 | 14.4 |
| – Percent of Open Interest Shorts: | 7.5 | 65.5 | 10.2 |
| – Net Position: | 24,464 | -36,472 | 12,008 |
| – Gross Longs: | 45,620 | 149,372 | 40,817 |
| – Gross Shorts: | 21,156 | 185,844 | 28,809 |
| – Long to Short Ratio: | 2.2 to 1 | 0.8 to 1 | 1.4 to 1 |
| NET POSITION TREND: | |||
| – Strength Index Score (3 Year Range Pct): | 78.4 | 32.4 | 39.9 |
| – Strength Index Reading (3 Year Range): | Bullish | Bearish | Bearish |
| NET POSITION MOVEMENT INDEX: | |||
| – 6-Week Change in Strength Index: | 24.9 | -11.4 | -21.6 |
Bloomberg Commodity Index Futures:
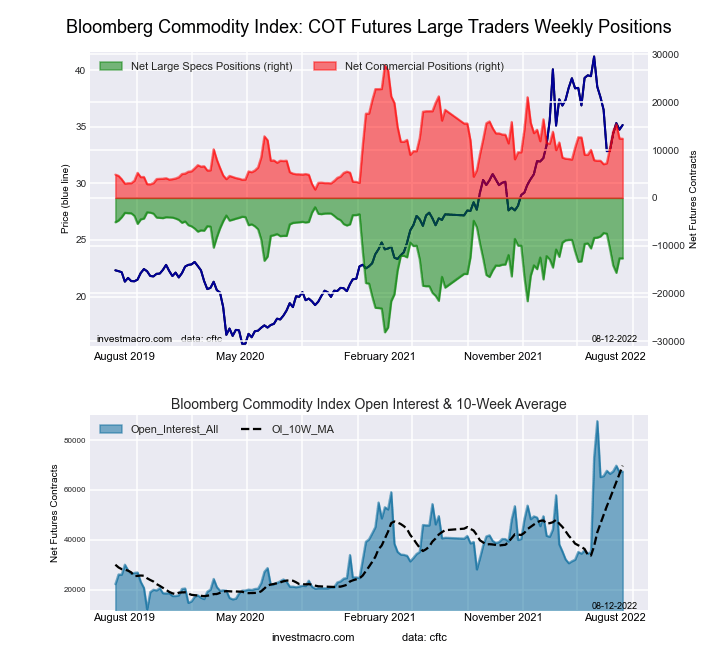
The Bloomberg Commodity Index Futures large speculator standing this week equaled a net position of -12,656 contracts in the data reported through Tuesday. This was a weekly decline of -33 contracts from the previous week which had a total of -12,623 net contracts.
This week’s current strength score (the trader positioning range over the past three years, measured from 0 to 100) shows the speculators are currently Bullish with a score of 59.1 percent. The commercials are Bearish with a score of 40.9 percent and the small traders (not shown in chart) are Bearish with a score of 20.5 percent.
| Bloomberg Index Futures Statistics | SPECULATORS | COMMERCIALS | SMALL TRADERS |
| – Percent of Open Interest Longs: | 23.9 | 74.0 | 0.6 |
| – Percent of Open Interest Shorts: | 42.7 | 55.7 | 0.2 |
| – Net Position: | -12,656 | 12,375 | 281 |
| – Gross Longs: | 16,115 | 49,878 | 386 |
| – Gross Shorts: | 28,771 | 37,503 | 105 |
| – Long to Short Ratio: | 0.6 to 1 | 1.3 to 1 | 3.7 to 1 |
| NET POSITION TREND: | |||
| – Strength Index Score (3 Year Range Pct): | 59.1 | 40.9 | 20.5 |
| – Strength Index Reading (3 Year Range): | Bullish | Bearish | Bearish |
| NET POSITION MOVEMENT INDEX: | |||
| – 6-Week Change in Strength Index: | -20.3 | 20.5 | -1.1 |
More By This Author:
Currency Speculators Trim Japanese Yen Bearish Bets While Brazilian Real Bets Fall To Bearish Level
COT Week 31 Charts: Soft Commodities Speculator Bets Rose Higher This Week Led By Corn & Soybean Oil
Bonds Speculators Bets Drop This Week Led By Fed Funds, Eurodollar & 10-Year Bond
Disclosure: Foreign Currency trading and trading on margin carries a high level of risk and can result in loss of part or all of your investment.Due to the level of risk and market volatility, ...
more

