
Join Our Telegram channel to stay up to date on breaking news coverage
The Ripple price prediction is down by 0.85% in the last few hours as the current market value goes below $0.38.
Ripple Prediction Statistics Data:
- Ripple price now – $0.37
- Ripple market cap – $18.3 billion
- Ripple circulating supply – 49.1 billion
- Ripple total supply – 99.9 billion
- Ripple Coinmarketcap ranking – #7
XRP/USD Market
Key Levels:
Resistance levels: $0.50, $0.55, $0.60
Support levels: $0.20, $0.15, $0.10
Your capital is at risk.
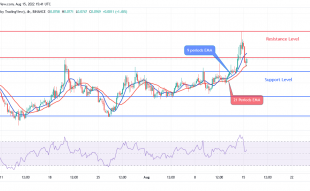
XRP/USD is hovering at $0.31 below the 9-day moving average and the coin is likely to slide below this level and face the south. However, the Ripple price is trading at the downside while the Relative Strength Index (14) keeps moving below 40-level. Nevertheless, any bearish move below this barrier may give the market enough strength to dig a dip, but crossing above the moving averages may lead the market to the upside.
Ripple (XRP) Ranges; Tamadoge (TAMA) on a Bull Ride
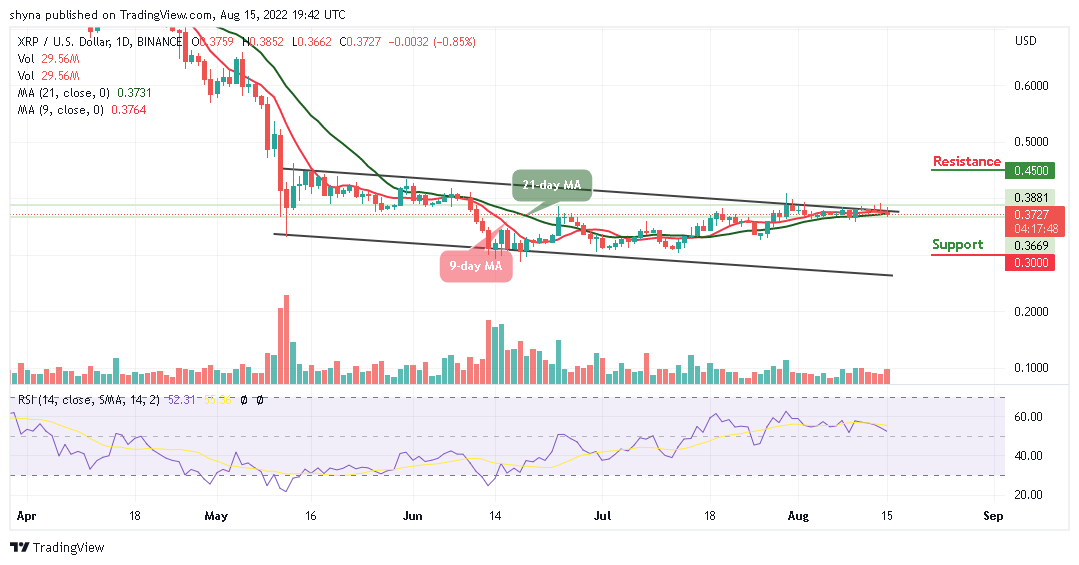
The Ripple price continues to show signs of weakness across its markets as the coin loses 0.85%, range-bounding within the market. Therefore, since the Ripple price is moving sideways, traders can expect the trend to keep moving lower if the price action heads toward the lower boundary of the channel.
However, any bullish movement above the upper boundary of the channel could strengthen the bulls and push the price to the resistance levels of $0.45, $0.47, and $0.49, but any further bearish movement could lead the market to the supports at $0.30, $0.28, and $0.27.
When compared with Bitcoin, the Ripple price is hovering below the 9-day and 21-day moving averages. Therefore, if the selling pressure increases, XRP/BTC may create a new low by touching the nearest support at 1500 SAT. Now, the technical indicator Relative Strength Index (14) moves around the 40-level; traders may continue to see a negative move within the channel if crosses below the lower boundary of the channel.
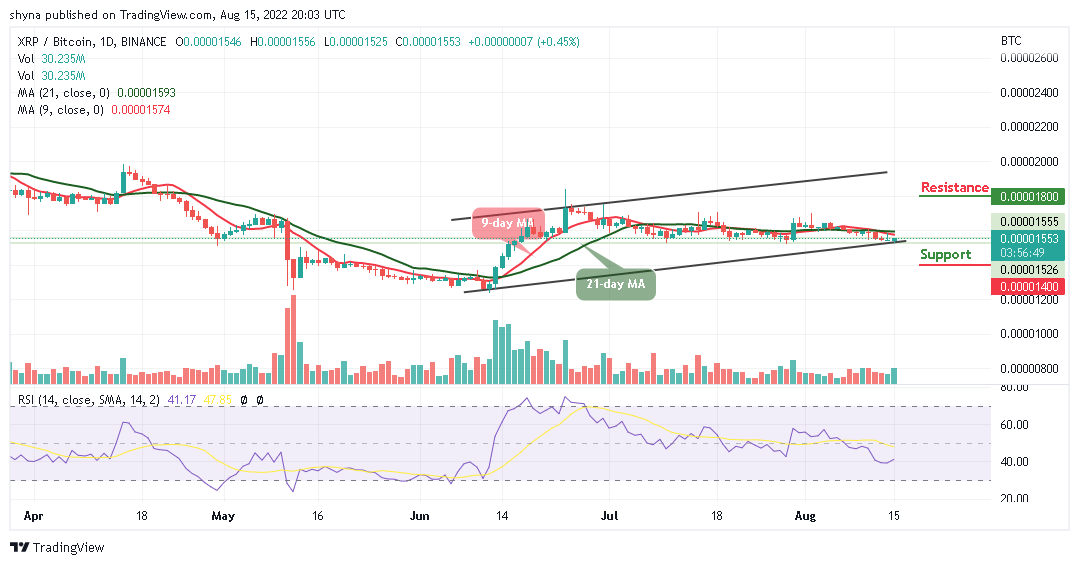
However, the Ripple (XRP) is currently changing at 1553 SAT, therefore, if the coin drops below the current value, the market may break to the support level of 1400 SAT and below. Nevertheless, if the Ripple price moves and crosses above the moving averages; the nearest resistance level could be located at 1800 SAT and above.
Related
Join Our Telegram channel to stay up to date on breaking news coverage