Friday, September 9, 2022 10:50 AM EDT

Photo by Mika Baumeister on Unsplash
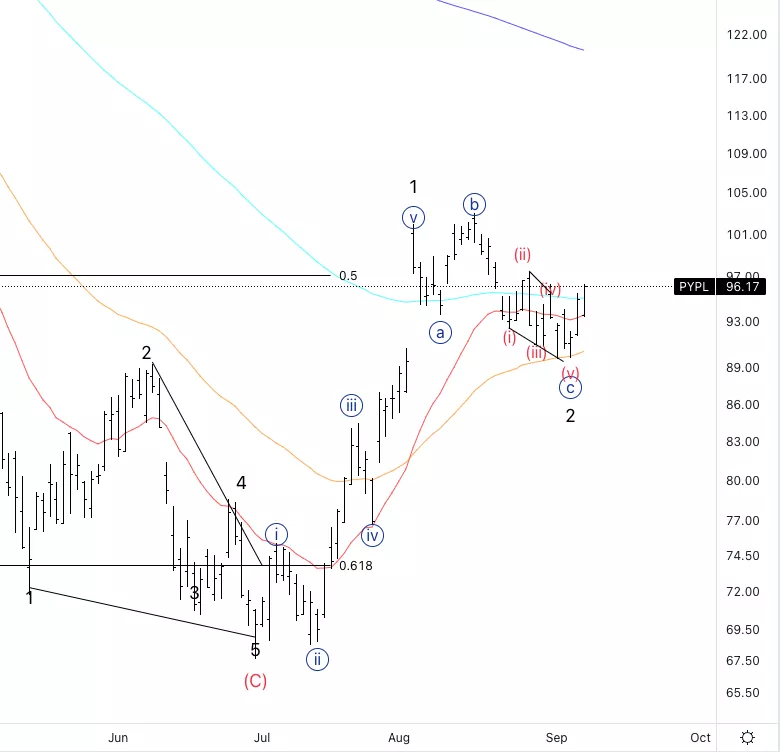
PayPal Holdings Inc.,(Nasdaq: PYPL): Daily Chart, September 9, 2022,
PYPL Stock Market Analysis: PayPal moving as expected. We were anticipating a potential ending diagonal in wave {c} of 2 to then resume to the upside. We are moving higher, however, it’s still early to say whether or not we have resumed the uptrend.
PYPL Elliott Wave count: {c} of 2.
PYPL Trading Strategy: Looking for wave (ii) to then place longs. s
PYPL Technical Indicators: The 20 EMA is acting as support.
Analyst: Alessio Barretta
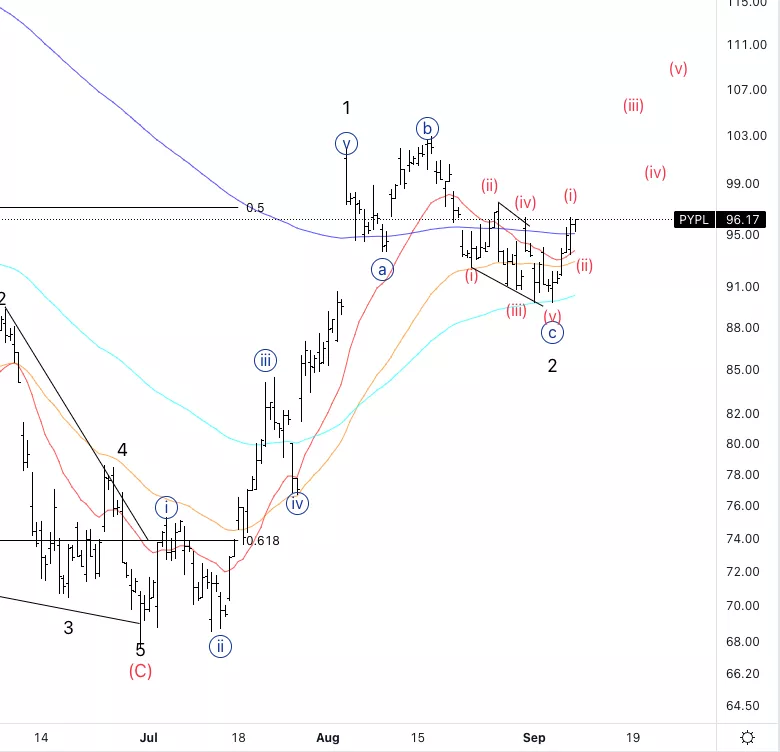
PayPal Holdings Inc., PYPL: 4-hour Chart, September 9, 2022
PayPal Holdings Inc., Elliott Wave Technical Analysis
PYPL Stock Market Analysis: Moving higher with a steep angle of ascent could indicate the resumption of the uptrend.
PYPL Elliott Wave count: (i) of {i}.
PYPL Technical Indicators: We broke through the 200EMA which could then turn out to act as support.
PYPL Trading Strategy: Looking for a buyable pullback, i.e. a pullback in a three-wave structure.
More By This Author:
Euro Indices Elliott Wave Trading Strategies
SP500 Elliott Wave Analysis | Bear Market Corrective Rally
Elliott Wave Technical Analysis: Pinterest, Thursday, Sept. 8
Disclosure: As with any trading or investment opportunity there is a risk of making losses especially in day trading or investments that Trading Lounge expresses opinions on. Note: Historical ...
more
Disclosure: As with any trading or investment opportunity there is a risk of making losses especially in day trading or investments that Trading Lounge expresses opinions on. Note: Historical trading results are no guarantee of future returns. Some investments are inherently more risky than others. At worst, you could lose your entire investment and more TradingLounge™ uses a range of technical analysis tools, such as Elliott Wave, software and basic fundamental analysis as well as economic forecasts aimed at minimising the potential for loss. The advice we provide through our TradingLounge™ websites and our TradingLounge™ Membership has been prepared without taking into account your particular objectives, financial situation or needs. Reliance on such advice, information or data is at your own risk. The decision to trade and the method of trading is for you alone to decide, tradinglounge takes no responsibility whatsoever for your trading profits or losses. This information is of a general nature only, so you should, before acting upon any of the information or advice provided by us, consider the appropriateness of the advice in light of your own objectives, financial situation or needs. Therefore, you should consult your financial advisor or accountant to determine whether trading in Indices Stocks shares Forex CFDs Options Spread Betting derivatives of any kind / products is appropriate for you in light of your financial trading circumstances.
less
How did you like this article? Let us know so we can better customize your reading experience.


