
Gold Fell Under Its 2021 Lows; Ready For The Real Slide?
It seems that the biggest part of the 2013-like decline is taking place in the gold market. Is it a harbinger of the next phase of the yellow metal’s fall?
Today’s issue will be a bit shorter but also more focused on what just happened. Given that gold just broke below not only the 2022 lows but also the 2021 lows, it seems that the most volatile part of the medium-term decline is happening right now, so I thought that you’d appreciate extra details about the short run more than another long-term recap.
Even if you usually skip the text and get right to the summary, I suggest that you read today’s analysis in full.
If you’re looking for the long-term recap, please note that practically everything that I wrote about the long term last Friday remains up-to-date today as well – the markets simply did what I wrote back then. In fact, the markets (in particular, the precious metals market) have been doing what I’ve been writing about for months now. Anyway, here’s the link to last Friday’s analysis, should you want to revisit it.
Last Friday’s analysis was entitled “The Medium-Term Downtrend Can Resume Anytime in the Gold Market” – and that’s exactly what happened.
Still, let’s start today’s analysis with a recap of what recently happened on the fundamental front.
The Weekly Fundamental Roundup
With inflation showcasing its might once again, this week was all about dashed hopes for a resumption of the bull market. Moreover, with gold, silver, mining stocks, and the S&P 500 suffering sharp drawdowns on Sep. 15, investors learned the hard way that normalizing unanchored inflation is extremely difficult.
In addition, while the permabulls focused their attention on the Russia-Ukraine conflict, I warned on Apr. 11 that the domestic fundamental environment was profoundly bearish for the PMs. I wrote:
With real interest rates poised to turn positive in the coming months, gold should suffer profoundly once its war premiums unravel.
The historical fundamental playbook shows:
- When a crisis erupts, the Fed cuts interest rates and commences QE;
- Real yields turn deeply negative;
- Gold rallies sharply;
- As the Fed normalizes monetary policy, real yields surge and gold plunges.
Please see below:
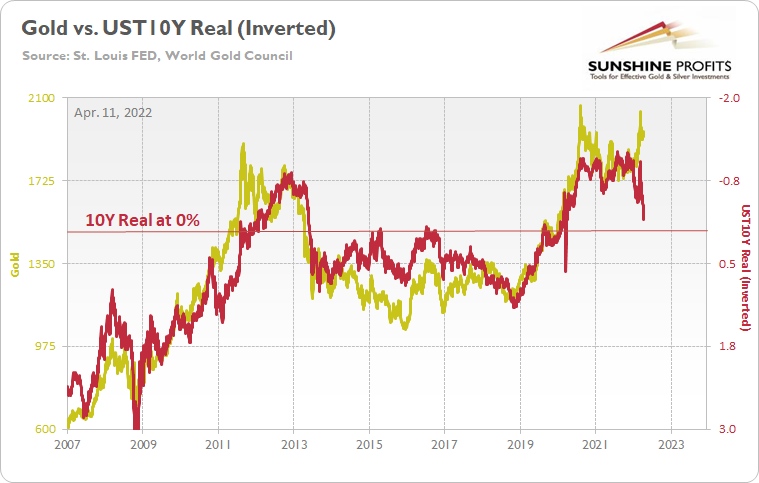
To explain, the gold line above tracks the price tallied by the World Gold Council, while the red line above tracks the inverted U.S. 10-Year real yield. For context, inverted means that the latter's scale is flipped upside down and that a rising red line represents a falling U.S. 10-Year real yield, while a falling red line represents a rising U.S. 10-Year real yield.
Moreover, while I've shown variations of this chart before, the long-term implications are profound. For example, if you analyze the left side of the chart, you can see that the U.S. 10-Year real yield soared and gold plunged during the global financial crisis (GFC). However, when the Fed launched QE and the U.S. 10-Year real yield sank to an all-time low, gold hit a new all-time high along the way.
Furthermore, the current situation is a spitting image. When Fed Chairman Jerome Powell performed a dovish pivot in late 2018, the U.S. 10-Year real yield suffered. Then, when the Fed fired its liquidity bazooka in March 2020, it pushed the metric to another all-time low. And surprise, surprise, gold hit another all-time high.
However, we're now in stage four of the historical fundamental playbook. With the Fed normalizing policy, the U.S. 10-Year real yield has surged in recent weeks. Moreover, the Fed needs to push the metric above 0% to curb inflation.
To that point, with the hawkish forecast becoming a hawkish reality, the U.S. 10-Year real yield closed above 1% on Sep. 15 for the first time since 2018. Likewise, while gold closed at a new 2022 low, the yellow metal is still far from reflecting its fundamental value.
Please see below:
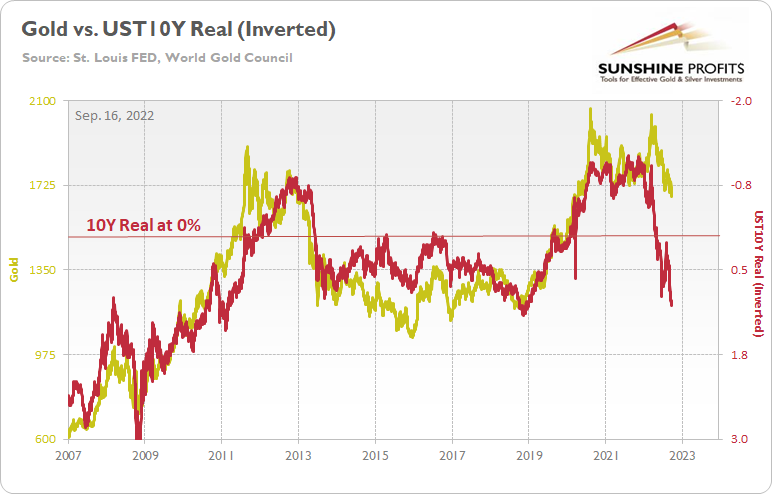
To explain, while the GDXJ ETF declined substantially in 2021 and 2022, gold has remained relatively uplifted. Moreover, with the U.S. 10-Year real yield near its 2018 highs, gold was meaningfully below $1,500 during that time period. As a result, the fundamentals align with the technicals, and more downside should confront gold, silver, and mining stocks over the medium term.
Hawkish Fuel
With the U.S. labor market demonstrating immense resiliency, the employment situation continues to support additional rate hikes in the months ahead. Furthermore, a realization is bullish for the USD Index and the U.S. 10-Year real yield and bearish for the PMs.
For example, unanchored inflation means that one-half of the Fed's dual mandate is materially out of whack. However, initial unemployment claims sank to their lowest level since May on Sep. 15, and the data highlights how the U.S. labor market is not weakening at a pace that would materially reduce wage inflation.
Therefore, the second half of the Fed's dual mandate remains healthy, and that should allow officials to focus their attention on curbing inflation.
Please see below:
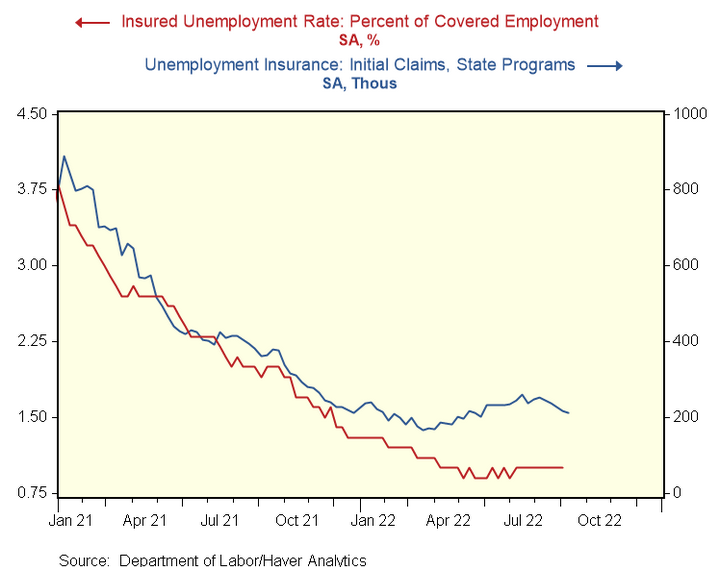
To explain, the blue line above tracks initial unemployment claims while the red line above tracks the insured unemployment rate. For context, the Fed defines the latter as “the number of people currently receiving unemployment insurance as a percentage of the labor force.” Thus, with joblessness far from crisis levels, the labor market outlook should keep the Fed’s foot on the hawkish accelerator.
As further evidence, the New York Fed released its Empire Manufacturing Survey on Sep. 15. The headline index increased from -31.3 to -1.5. Moreover, while the “Price indexes moved notably lower, pointing to a deceleration in price increases,” the report revealed that “labor market indicators pointed to a modest increase in employment.”
As a result, with an already tight U.S. labor market continuing to add jobs, it creates a Goldilocks environment where the Fed can raise interest rates without worrying about the political consequences of hurting the average American.
Please see below:
Source: NY Fed
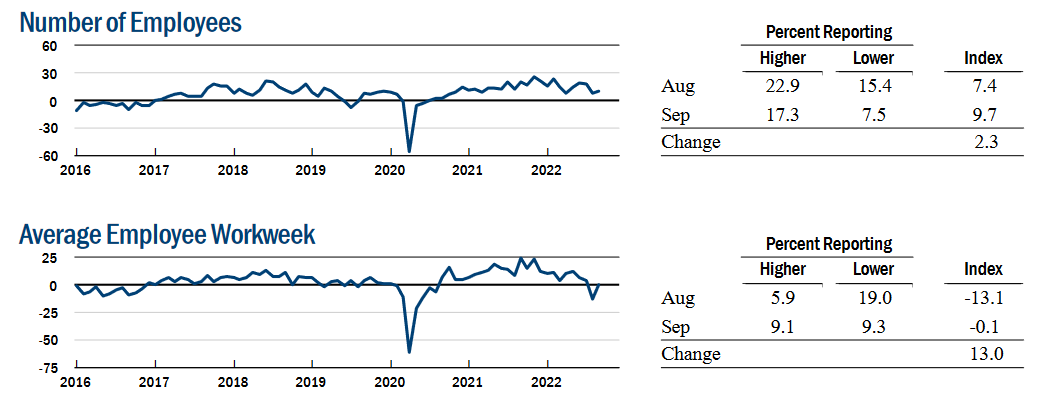
Continuing the theme, the Philadelphia Fed released its Manufacturing Business Outlook Survey on Sep. 15. The headline index declined from 6.2 in August to -9.9 in September. Moreover, while the "prices paid index declined for the fifth consecutive month," the "prices received index moved up 6 points to 29.6."
Therefore, "the indicators for prices paid and prices received remained positive but indicate less widespread increases in prices compared with previous months."
However, while inflationary pressures subsided somewhat, employment remained resilient. An excerpt read:
"On balance, the firms continued to report increases in employment, but the employment index declined from 24.1 to 12.0. Nearly 15% of the firms reported increases in employment, compared with 3% that reported decreases; 83% reported no change."
As such, a net of ~12% of Philadelphia manufacturers increased their headcount in September, while 83% kept their staffing levels constant. Thus, the kind of labor market destruction that would allow the Fed to pivot is not present in the data.
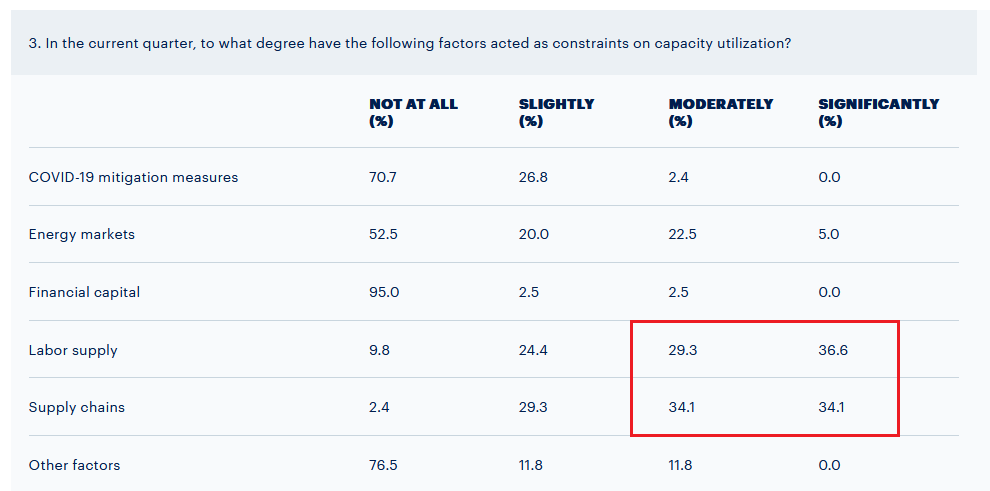
To that point, this month's special questions showed that "the share of firms reporting expected increases in third-quarter production (56%) exceeded the share reporting decreases (22%). Likewise, when asked about the factors "constraining capacity utilization in the current quarter," the overwhelming majority cited a lack of labor supply and supply-chain disruptions as moderate and significant issues. Therefore, the findings are profoundly inflationary.
Please see below:
Source: Philadelphia Fed
To explain, nearly 66% of Philadelphia manufacturers cited a lack of labor supply as a moderate or significant issue limiting their growth potential. In addition, supply-chain disruptions are also highly problematic. However, with the former highlighting how demand still outstrips supply in the U.S. labor market, the Fed is a long way from normalizing wage inflation, and therefore, output inflation.
Remember, U.S. consumers can afford price increases that match their wages. So, unless the Fed reduces wage inflation to 2%, output inflation is unlikely to fall to 2%. Furthermore, the labor shortage highlights why a 2.5% U.S. federal funds rate (FFR) is nowhere near neutral and why the metric needs to go substantially higher.
Finally, I noted on Sep. 13 that Americans continue to spend at a furious pace. I wrote:
Mastercard released its SpendingPulse U.S. retail sales report on Sep. 12. An excerpt read:
“The holiday season builds on the momentum seen this summer, with U.S. retail sales excluding automotive in August up +11.7% YoY and +20.4% compared to 2019. Online sales in August grew +8.9% and +100.2% respectively, compared to the same periods. Experiential sectors in particular – including Restaurants, Airlines and Lodging – saw strong double-digit growth.”
Please see below:
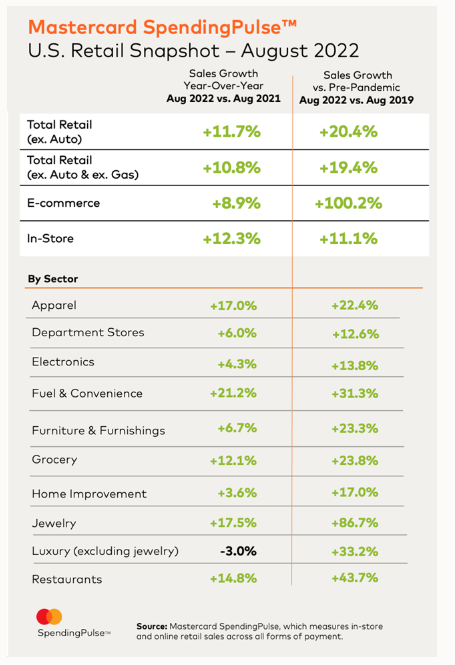
Thus, with U.S. consumers continuing to splurge on their favorite items, we’re nowhere near the demand destruction that would alleviate inflation. Moreover, while I’ve warned repeatedly that investors miscalculated the demand side of the inflation equation, Mastercard’s spending data highlights why the Fed’s fight will be so difficult.
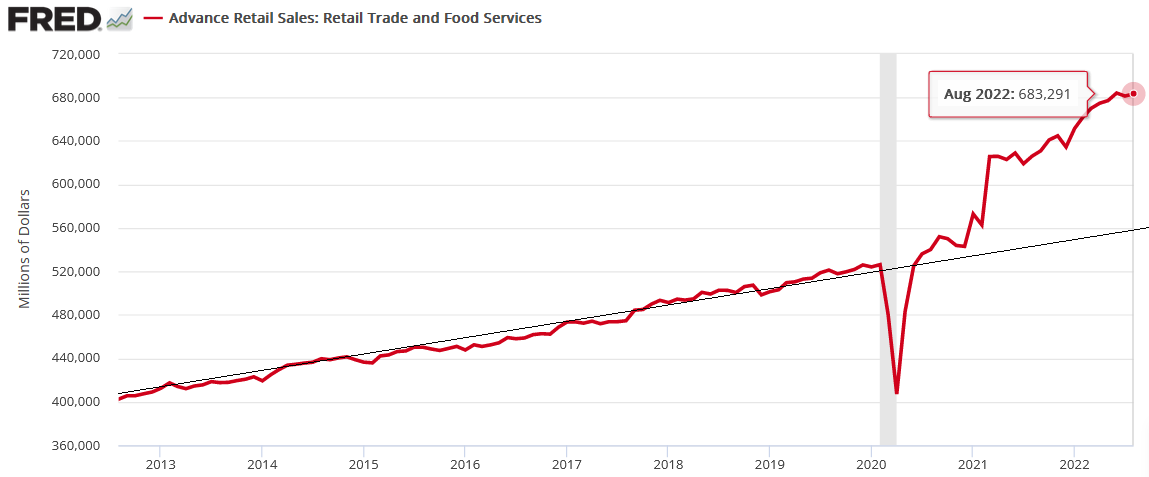
Likewise, the U.S. Consensus Bureau released its retail sales report on Sep. 15. Moreover, with August’s data up by 0.3% month-over-month (MoM), consumer spending remains well above its 10-year trend. As a result, the Fed is a long way from solving its inflation conundrum.
The Bottom Line
While investors assumed that demand would fall off a cliff, the reality is that the U.S. labor market and consumer spending are extremely resilient. Therefore, outside of cooling the U.S. housing market, the Fed’s 2022 rate hikes have done little to normalize wage inflation or materially reduce Americans’ spending habits.
Thus, while the USD Index and the U.S. 10-Year real yield have been among the best-performing assets in 2022, they need to rise further to alleviate the pricing pressures. As such, investors drastically underestimate the challenges that lie ahead, and the PMs should suffer mightily as more hawkish policy commences.
What to Watch for Next Week
With more U.S. economic data releases next week, the most important are as follows:
- Sep. 21: FOMC meeting, Summary of Economic Projections (SEP), Chairman Jerome Powell’s press conference.
While the latest Consumer Price Index (CPI) release elicited fears of a 75 or 100-basis point rate hike, the real story is the Fed’s SEP. It will be interesting to see if officials increased their 2023 median projection for the FFR. Likewise, Powell’s presser is also immensely important.
- Sep. 22: KC Fed manufacturing index
Similar to the New York and Philadelphia Fed’s regional reports, the KC Fed’s data will highlight the growth, employment, and inflation developments in Missouri.
- Sep. 23: S&P Global Composite PMI
S&P Global's data is obtained from a nationwide survey, so it's more relevant than the regional reports and is one of the most important releases of the week.
All in all, economic data releases impact the PMs because they impact monetary policy. Moreover, if we continue to see higher employment and inflation, the Fed should keep its foot on the hawkish accelerator. If that occurs, the outcome is profoundly bearish for the PMs.
The FOMC is Coming – So What?
Let’s take an extra look at the paragraph about Sep. 21. I put two parts thereof in bold.
The key thing is that the market now expects interest rates to be raised by at least 0.75%. In fact, right now, about 3/4 of market participants now expect the rates to be hiked by 0.75%, and about 1/4 expect that the rates will be hiked by 1%.
Please remember that the markets’ participants’ expectations tend to move from one extreme to the other, and while previously people became way too dovish, it seems that they have now become excessively bearish with regard to the short term.
Since it’s not clear to the market what’s going to happen, it will be surprising either way. A positive surprise would be bullish for stocks and other markets (like junior miners!), and a negative surprise would be bearish for stocks and other markets (like junior miners!).
The U.S. midterm elections are just around the corner, remember? Is the Fed likely to negatively surprise the market shortly before the elections? That seems very unlikely to me.
The Fed is now hiking interest rates by 0.75%, which means that it will be relatively easy – from the psychological point of view – it’s just the same thing over and over again. It will also be easy to defend when someone asks questions about the decision. “We steadily continue our policy as we’re approaching our goals, and those goals have not been met” – sounds believable, right? And it needs to sound believable if the Fed wants to “avoid the blame” for the stock market crash (that’s going to happen anyway).
So, in my opinion, the Fed won’t hike rates by 1% next week but rather by 0.75%. And then perhaps it will simply continue hiking in this way until the stocks crash and the public “screams” for some kind of relief.
But let’s not go that far. For now, the key thing is that while the rates are likely to be raised exactly by 0.75% next week, the markets are also likely to get a bullish trigger when this decision is made. And – given the looming elections – I wouldn’t be surprised to also hear Powell saying something bullish/dovish during his press conference.
Given the data on one hand and the election-related pressure, on the other hand, the optimal scenario for him seems to be to hike the rates but pretend that he didn’t. As an alternative to what I wrote above, the Fed could hike by 1% but then be very dovish in the speech, stating that they will consider pausing the hikes or something like that.
Either way, based on both the above-mentioned scenarios, the stock market would be likely to bottom once the rates are hiked. Not because that’s fundamentally bullish, but because that will be more dovish than what is being expected on average. In other words, some people will get their expectations fulfilled, but some will be surprised – in a dovish manner, as a 0.75% hike is smaller than a 1% hike.
And that’s only the event itself that I’ve covered so far.
There’s also the market’s tendency to act on the rumor and then reverse the fact. So, the above – bottom of the rate hike announcement that is already being expected – could happen even if everyone expected the Fed to hike by exactly 0.75%.
In other words, the markets tend to get ahead of themselves.
In this case, it’s quite likely that the markets are about to decline more than they “should” based on the expectations of about a quarter of market participants that the rates are going to be hiked by 1%.
This makes the above-mentioned scenario (markets could bottom close to the Fed’s rate hike decision and then we could see a temporary rebound) even more likely. The technicals support it too.
Technically Speaking
As I just wrote about the stock market, let’s take a closer look at it.
(Click on image to enlarge)
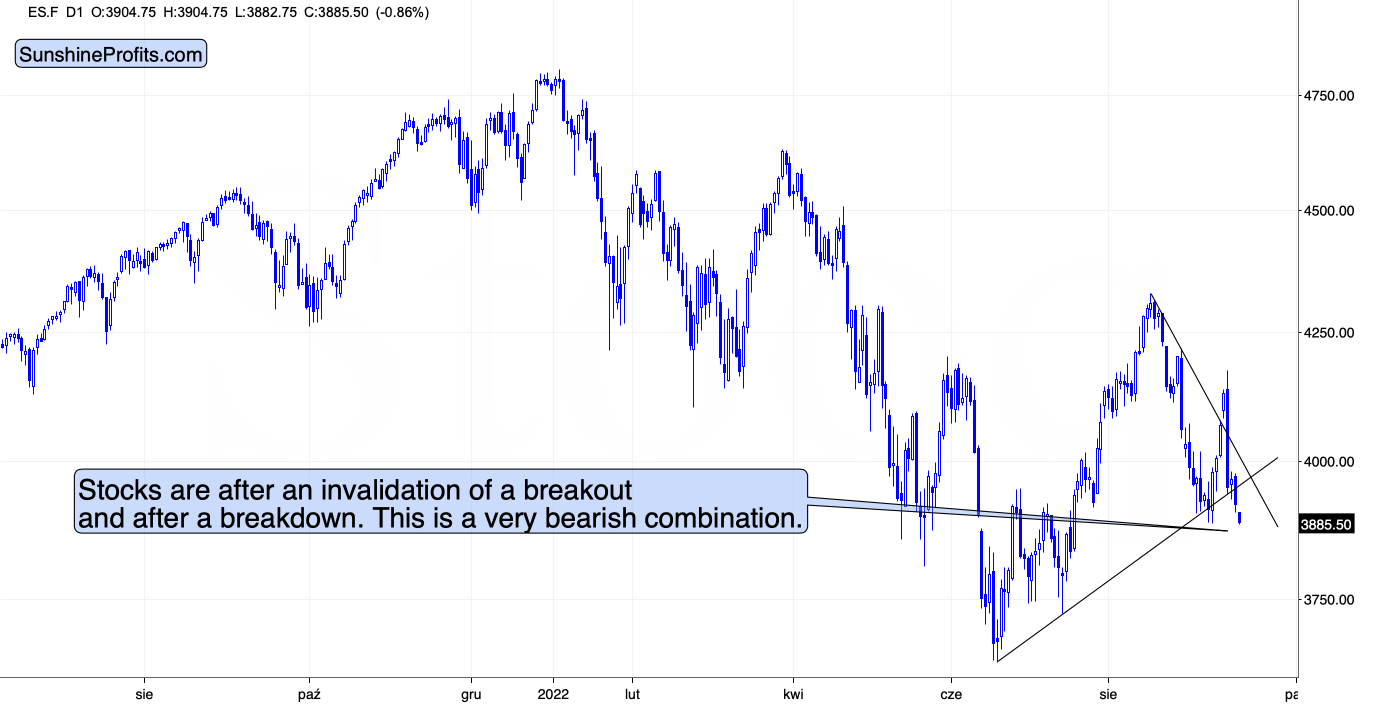
Stocks are after the invalidation of a breakout and right after a breakdown below a rising support line. They also just (in today’s pre-market trading) broke to new monthly lows.
This opens the door wide open to further declines. The previous 2022 lows provide support, but I wouldn’t be surprised stocks if fall even further before forming a short-term bottom.
(Click on image to enlarge)
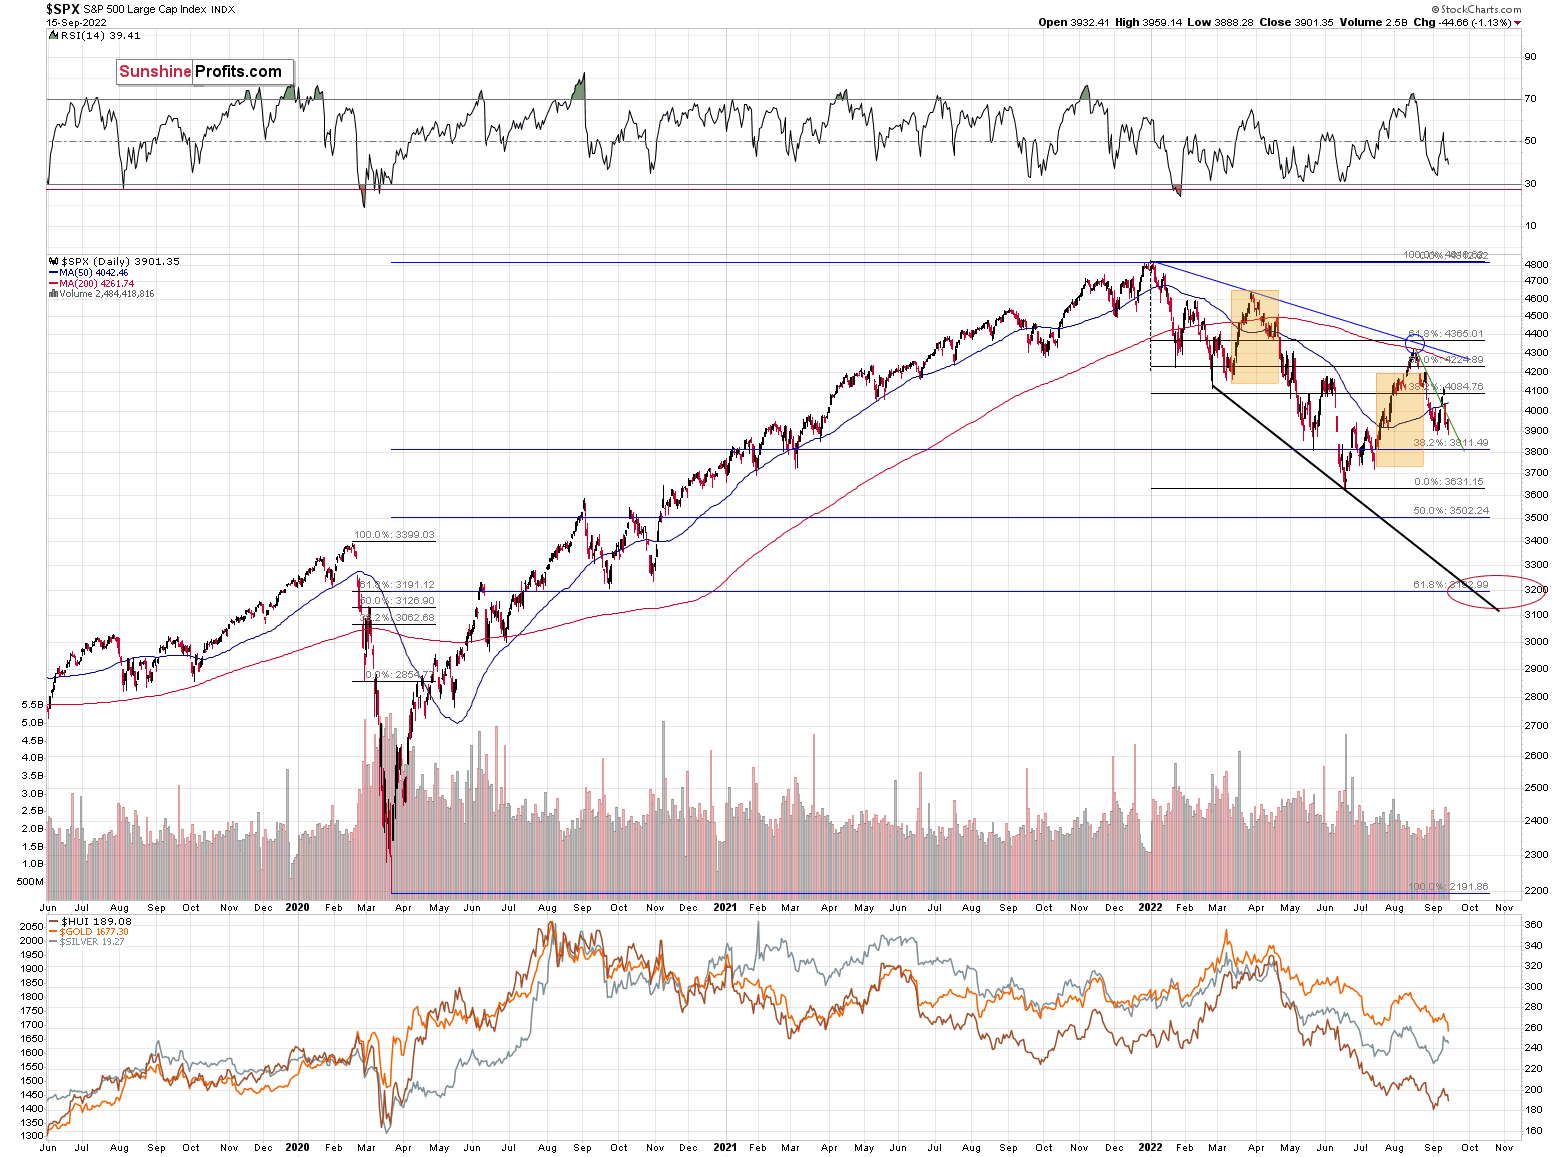
Based on the 50% Fibonacci retracement, the mid-2020 highs, and the fact that it’s a quite round number, there’s strong support at about 3,500 – that’s where we could see the next short-term bottom.
Yes, it’s far, but given how the rate expectations just shifted, that we just saw an invalidation of a breakout and a move to new monthly lows, it’s not unrealistic.
Speaking of breakdowns…
Gold Breaks Below the 2022 and 2021 Lows!
Gold is currently trading below its 2021 lows.
(Click on image to enlarge)
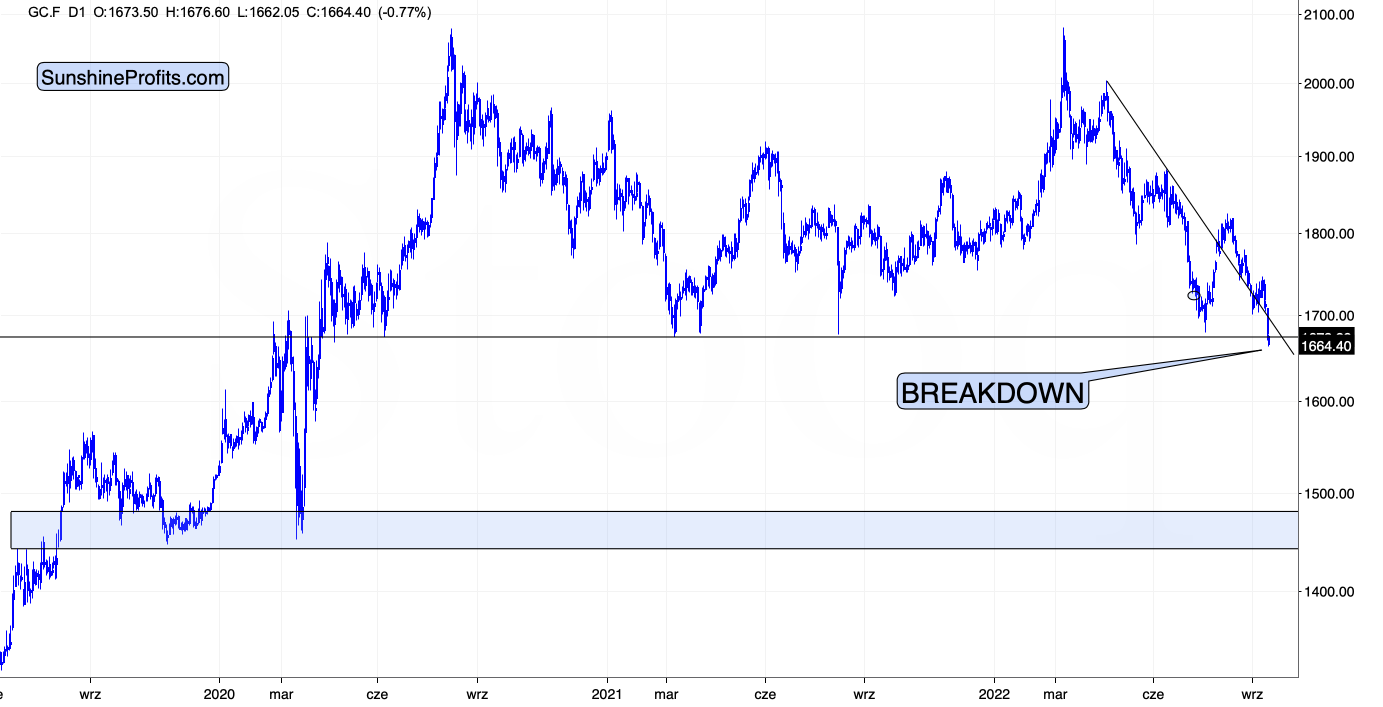
This. Is. Huge.
Remember the gold / real-yield chart from the fundamental part of today’s analysis? Based on that, gold should have been trading much lower recently. Why didn’t it plunge? Because of technical reasons. Given similar price moves and similar emotional environments (fear/greed combination that are ultimately represented by price/volume moves), markets behave in similar ways. What we see right now is a remarkably clear analogy to what we saw in 2013. Based on this analogy, we were likely to see a relatively steady decline with corrective upswings. That’s exactly what happened.
However, this week’s breakdown shows that the gold market is now ready to enter the next stage of the analogy. The stage on which it truly slides.
There is some support right below the $1,600 level based on the previous short-term bottom. However, based on the analogy to 2013, it seems that gold is likely to drop much more than just slightly below $1,600 before bouncing in a meaningful manner.
The really strong combination of support levels is located a bit below $1,500 – approximately between $1,450 and $1,480.
The 2020 lows seem to be the most notable – and thus most important – part of the entire support area. At that time, gold futures bottomed at $1,450.90, so any move below $1,460 can be viewed as the target being “in” – it will be “close enough” from the practical point of view.
(Click on image to enlarge)
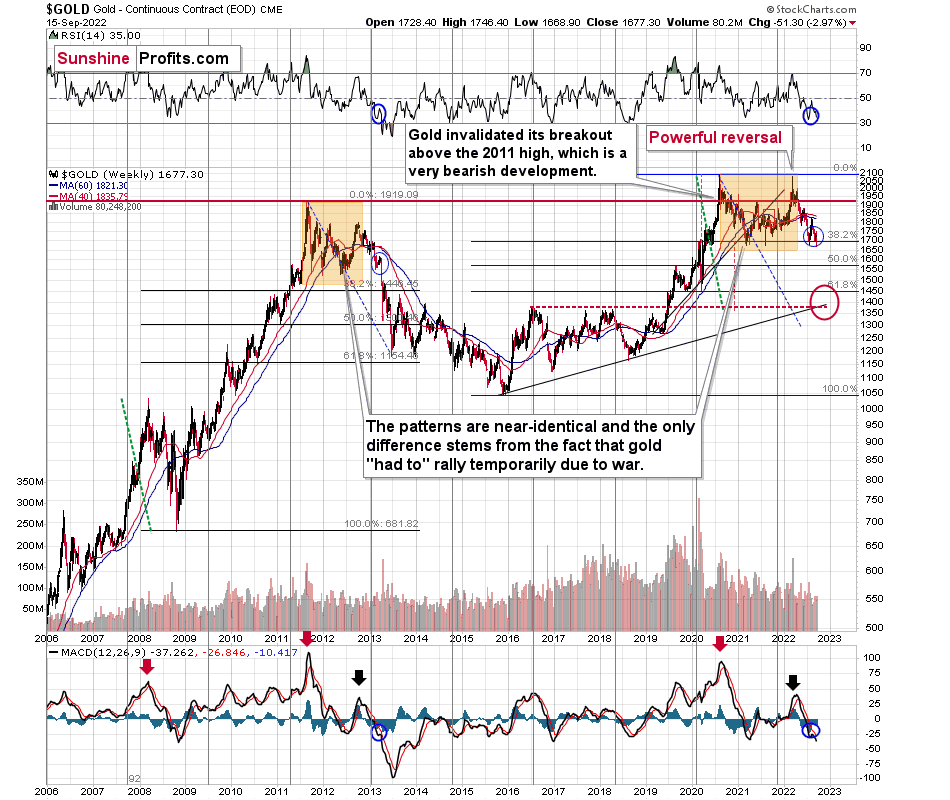
From the long-term point of view, that’s where we have the all-important 61.8% retracement based on the entire 2015-2020 rally. This makes the above-mentioned support even stronger.
Now, what I want to emphasize here is that when gold reaches $1,450, I think this will only be its initial bottom, not the final one.
Yes, a very important initial point, but still not the final one.
After gold moves to about $1,450, I expect it to bounce – perhaps to $1,550 or so. Then, after this rebound, I expect it to decline once again, just like what it did in 2013, and that bottom might be the final one for this decline – and for many years to come. Perhaps forever – in nominal terms, that is.
This final bottom is likely to take place close to gold’s 2016, 2017, and 2018 highs and close to its rising support line based on the 2015 and 2018 lows.
That’s a bit below $1,400, close to $1,390.
More By This Author:
Do Investors Still Believe That The Fed Is A Miracle Worker?Let’s Go Back To 2013 And Take A Look At The GDXJ Bearish Clues
Silver's Signature Trick: Soaring, Although It Means No Good
Disclaimer: All essays, research and information found on the Website represent the analyses and opinions of Mr. Radomski and Sunshine Profits' associates only. As such, it may prove wrong ...
more


Doesn’t matter, when they announce Fiat is abolished for CBDC, gold will go absolutely mental
good post