
Copper Strength Signaling Stronger Yuan
↵

Image Source: Pixabay
Copper is often referred to as “Dr. Copper” because it is used to gauge the health of the global economy. If the price of copper is moving higher, the world economy is thought to be strengthening. However, if the price of copper is moving lower, the world economy is said to be sick or weakening. As China continues to reopen is economy, traders are expecting a pickup in the demand for the industrial metal, hence, price is moving higher and taking out some key levels along the way! Over the last 5 trading days, Copper has moved from 3.7399 to 4.1607. Along the way, price has traded above the 200 Day Moving Average and the 38.2% Fibonacci retracement from the highs of March 7th, 2022, to the low of July 15th, 2022. In addition, Copper has moved above horizontal resistance and the 50% retracement from the same timeframe. If copper continues to move higher, the next resistance is the 61.8% Fibonacci retracement level and the highs of June 3rd, 2022 at 5.0371. However, notice that the RSI is in overbought territory, an indication that price may be ready for a correction. If price pulls back, support is at the previous horizontal resistance of 4.0343, the highs from December 27th, 2022 at 3.9393, and the 200 Day Moving Average at 3.8107.

Source: Tradingview, Stone X
Not all traders have access to trade copper. Therefore, a proxy can be used instead. In the bottom panel of the chart above is the correlation coefficient between Copper and the USD/CNH. A reading below -0.80 is considered a strong negative correlation. Therefore, Copper and USD/CNH have a strong negative correlation. When copper moves in one direction, USD/CNH should move in the opposite direction.
USD/CNH has been moving lower since making a 2022 high at 7.3748 on October 25th, 2022. More recently, the pair moved aggressively lower after making a near-term high on November 28th, 2022, at 7.2459. USD/CNH then consolidated during the month of December. On December 30th, 2022, price broke below the flag and is currently on its way to the flag target near 6.6757. Over the last 5 trading days, price has moved below the 200 Day Moving Average, as well as the 50% retracement level from the lows of 2022 to the highs of 2022 at 6.8412. If copper continues to move higher and the negative correlation holds, USD/CNH should continue to move lower. The next support is at the 61.8% Fibonacci retracement from the same timeframe near 6.7152, then the lows from June 3rd, 2022 at 6.6164. However, notice that RSI is in oversold territory (just as Copper was in overbought territory). This indicates that a correction may be ahead. Resistance is at the previous support level of 6.8381 and the 200 Day Moving Average of 6.8743.
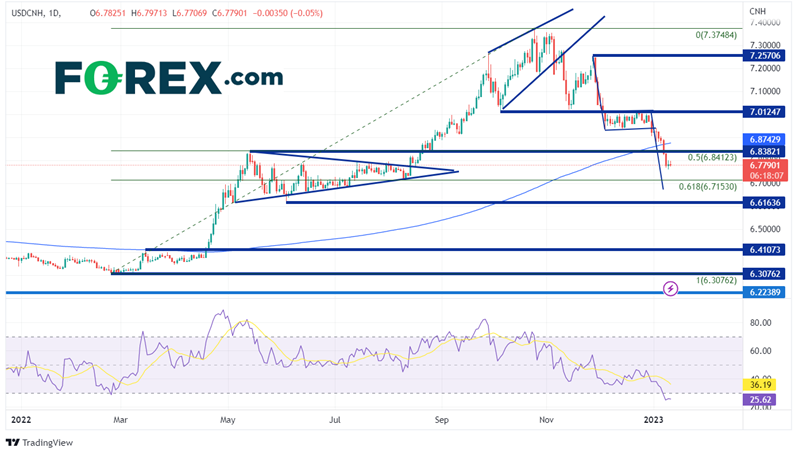
Source: Tradingview, Stone X
Copper has moved higher for the last 5 trading days. However, some traders don’t have access to trade the industrial metal. The correlation coefficient between Copper and USD/CNH is -0.83. As long as this correlation is below -0.80, USD/CNH could be used as a proxy for copper.
More By This Author:
U.S. CPI Preview: Will Lower Inflation Data Cause The Fed To Pause?
Currency Pair Of The Week: USD/CNH
Index In Focus: China A50


