
Calling The Fed’s Bluff: They Are Holding A Losing Hand

The Fed has talked a big game lately. Many people (including me) assumed the Fed would fold a long time ago. There is a very good reason — the Fed will crush the economy and the US Treasury with higher interest rates.
In reality, the Fed is holding a losing hand and trying to bluff its way to victory.
The following analysis is by SchiffGold’s data analyst.
So far, the Fed has defied the skeptics, stuck to its guns, and pressed forward. Despite the hawkish stance, we can actually still be sure the Fed is bluffing.
Everyone knows that at some point the higher interest rates will prove catastrophic. Putting a precise timeline on it is difficult, but also not impossible. Someone can actually run the numbers and see when the Fed will be forced to show their cards. So that’s what I did.
How?
I started with data published by the Treasury that shows their entire debt schedule each month down to the Cusip level. It shows the maturity dates and the interest rates. First, I ran a mini-Monte-Carlo using different fixed rates to see the general impact. Next, I combined the Treasury data with the Fed’s own forecast. As debt rolls over, I replaced maturing debt with new debt at the Fed’s forecasted rate.
I made a few assumptions for simplicity:
-
-
- The calculation was only run on Marketable debt, specifically Bills, Notes, and Bonds
- I added $100B a month in new debt plus the additional interest expense
- I applied the same rate to all maturity levels (the yield curve is currently inverted but also pretty flat relative to history)
- When debt rolls off, I replace it with the same maturity schedule (e.g., 2-year notes roll back into 2-year notes)
-
Let’s start with the mini Monte Carlo using different interest rates.
(Click on image to enlarge)
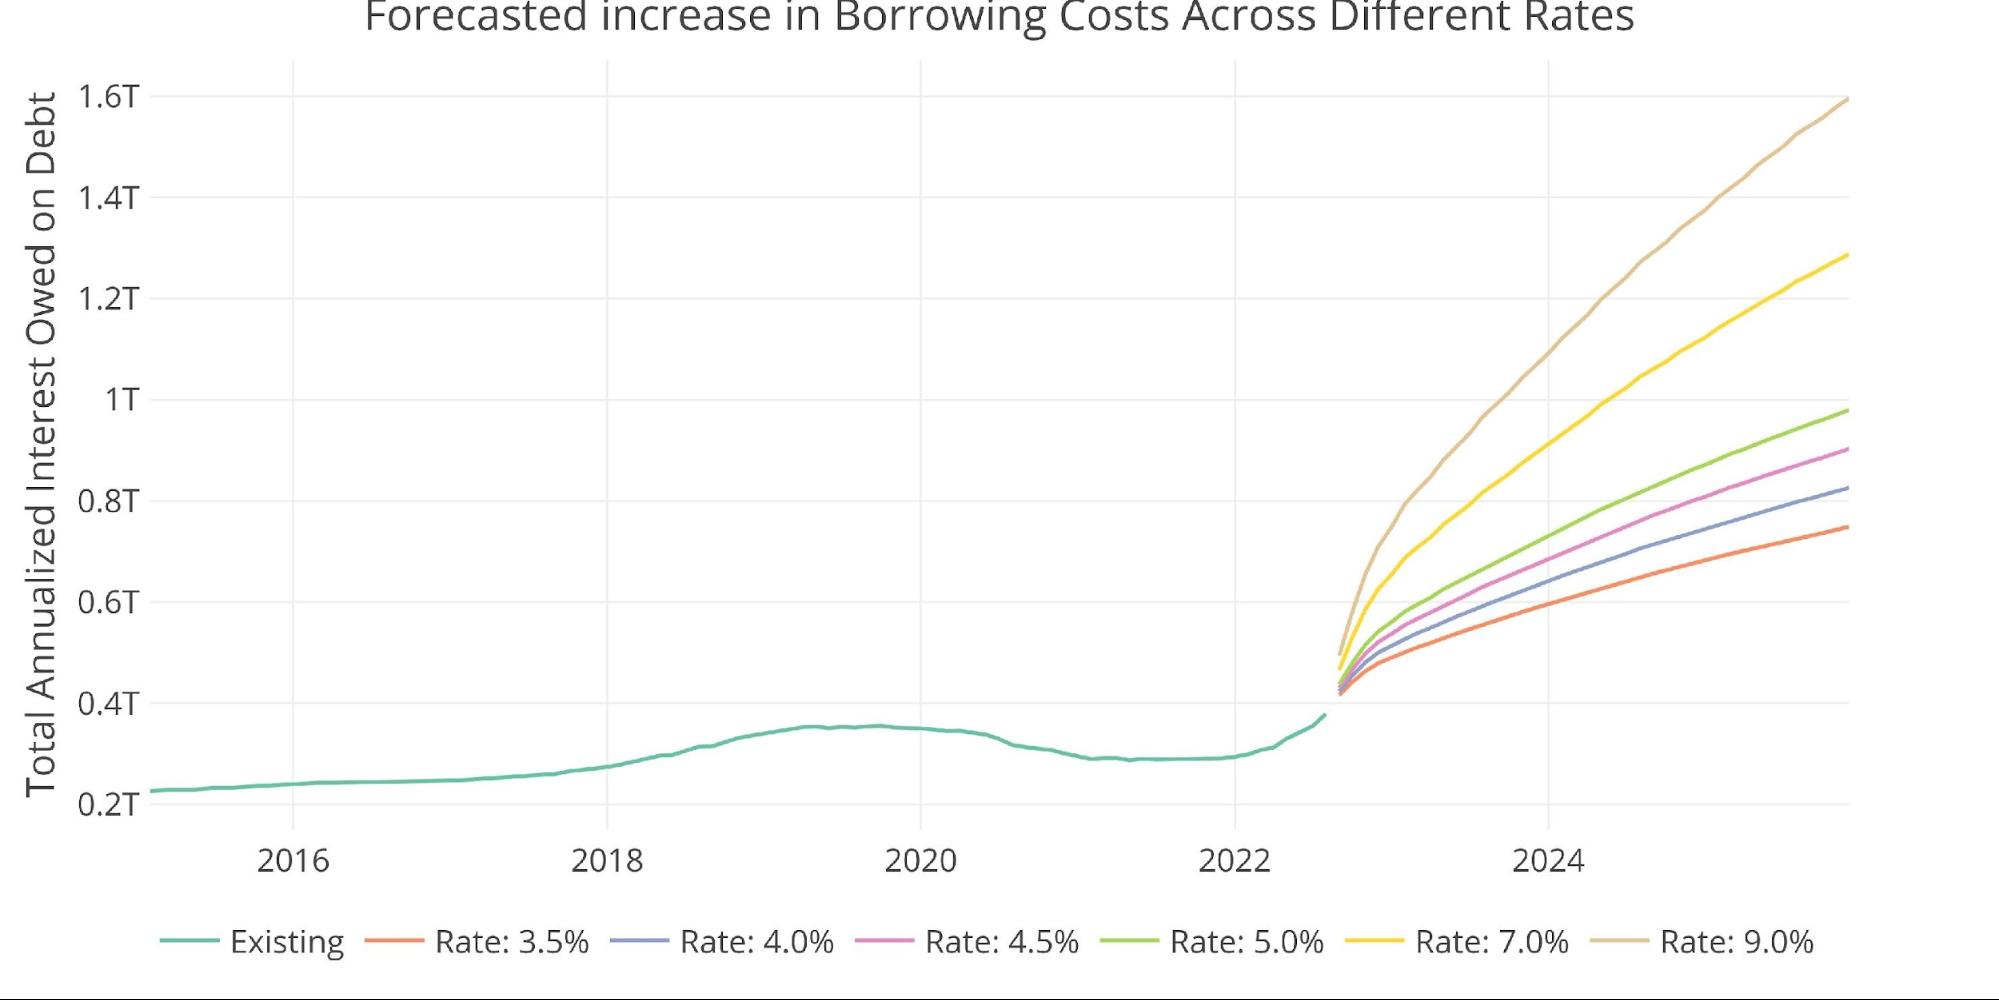
Figure: 1 Comparing Different Rates
Bam! Even the most conservative case (3.5%) shows that the debt gets unruly in a hurry. Under this scenario, the treasury is paying $600B a year in interest by January 2024. That is more than double the interest expense as recently as February 2022. Yes, double! And this is the scenario if the Fed were to freeze raising rates right now!
But, noooooo. The Fed needs to show they are serious. Powell is the new Volker and he has to prove it or the Fed could lose all credibility. So, last week they doubled down on their bluff. By the end of the year, they now anticipate rates at 4.4% rising to possibly 5% next year.
OK fine, let’s actually create this exact scenario. 4% in November, 4.4% in December, 5% in March 2023 for a full year, and then slowly lower rates in mid-2024 back to 3% by 2025. This is the Fed forecast.
(Click on image to enlarge)
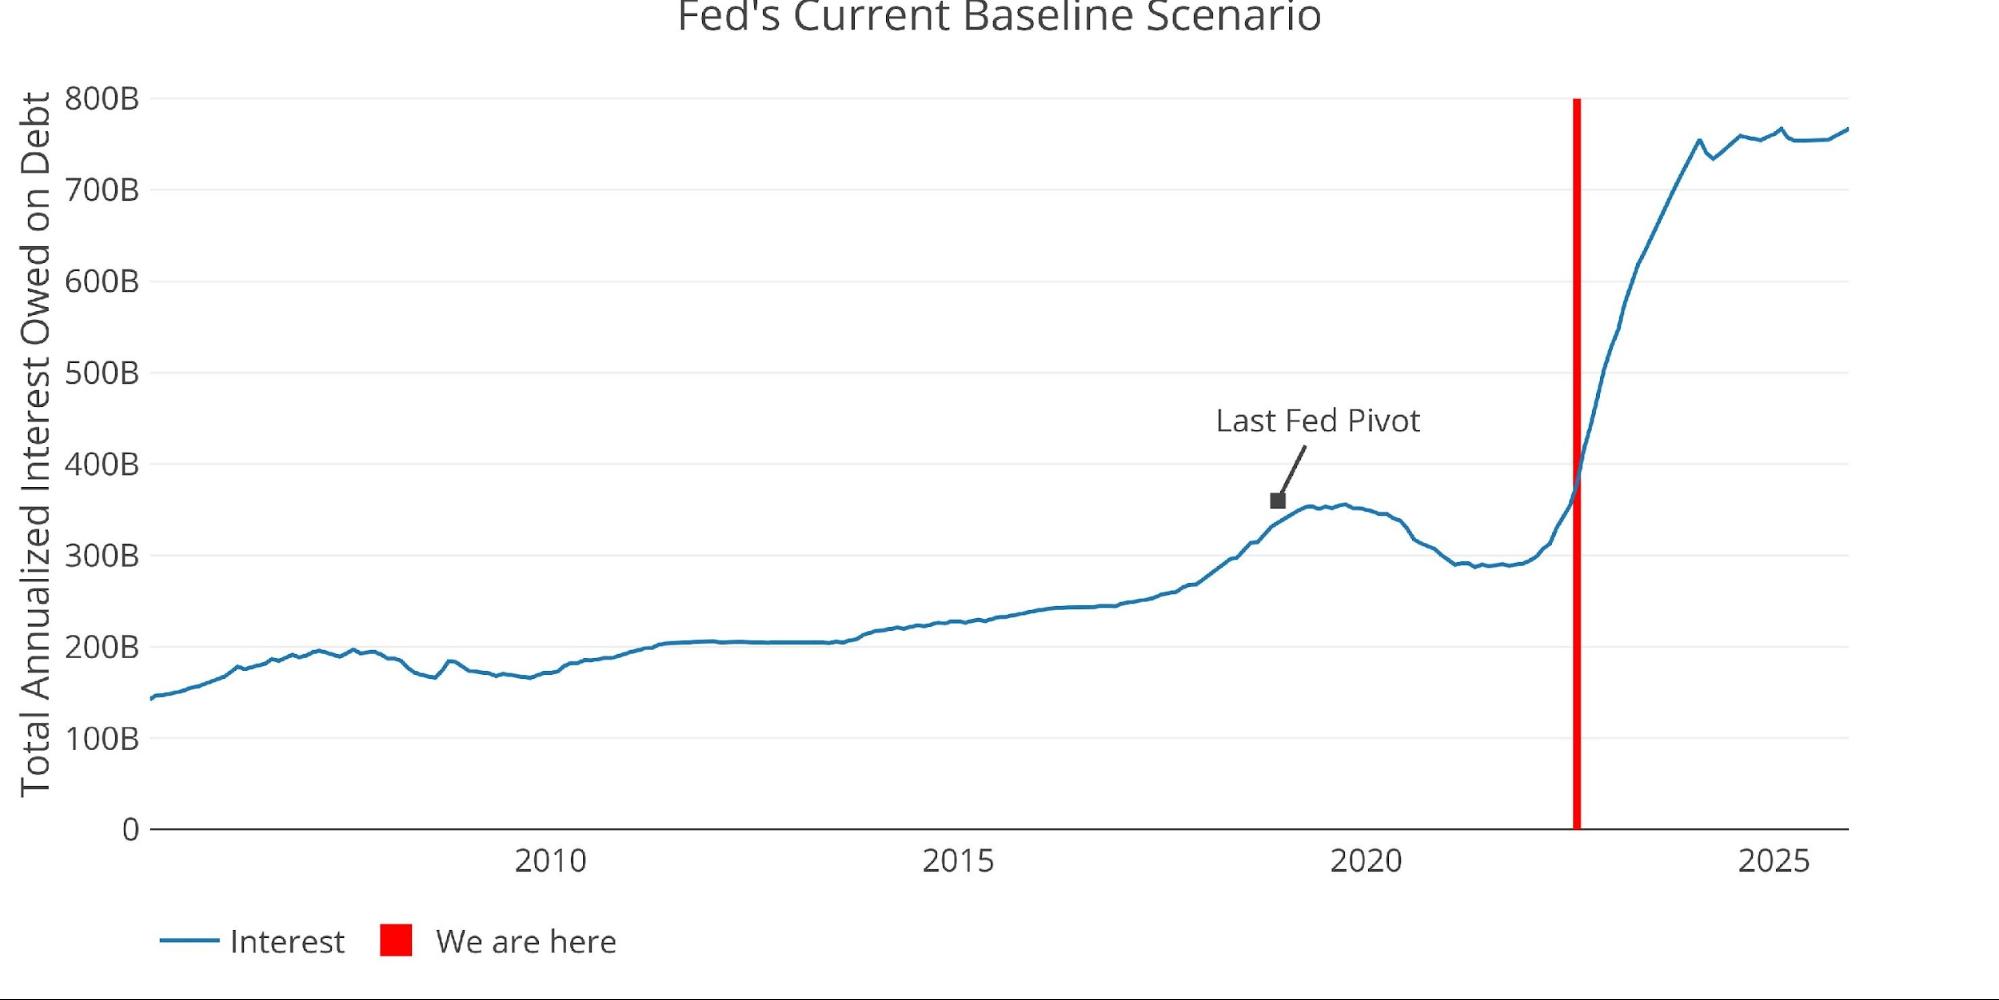
Figure: 2 The Current Fed Scenario
Take a minute to digest the chart above. Note how the next few months look relative to the last 20 years. This is not just a little extra strain on the economy. By Jan 2024 the Treasury will be hemorrhaging $740B in interest! That is almost $500B more than the Treasury was paying in 2021. Half a trillion dollars a year more in interest… in 15 months!! Remember when people freaked out about sending Ukraine $40B? This is 12x higher!
These are not made-up numbers or a worst-case scenario. This is using actual Treasury data against the Fed’s actual base case scenario. This is what’s going to happen if the Fed sticks to its current plan. Remember in 2018 when the Fed had to fold cause the market threw a fit? It’s marked on the plot above in case you forgot. Well, we just blew past that level in June.
The Fed is moving much faster this time, but the data is still on a lag. It’s going to take time for the Fed to notice when they have actually broken something. I’ll let you in on a secret though, they have already broken something… they just don’t know it yet (or maybe they do – just look at the currency markets). They moved slower in 2018, they had time to watch the data and see when the market started to convulse. It then took time for the interest level to peak and come back down after the pivot.
By the time they realize what they have done this time, it will probably be too late. Under this baseline scenario, debt will increase by a whopping $5T by the end of 2025. That is less than 40 months away.
(Click on image to enlarge)
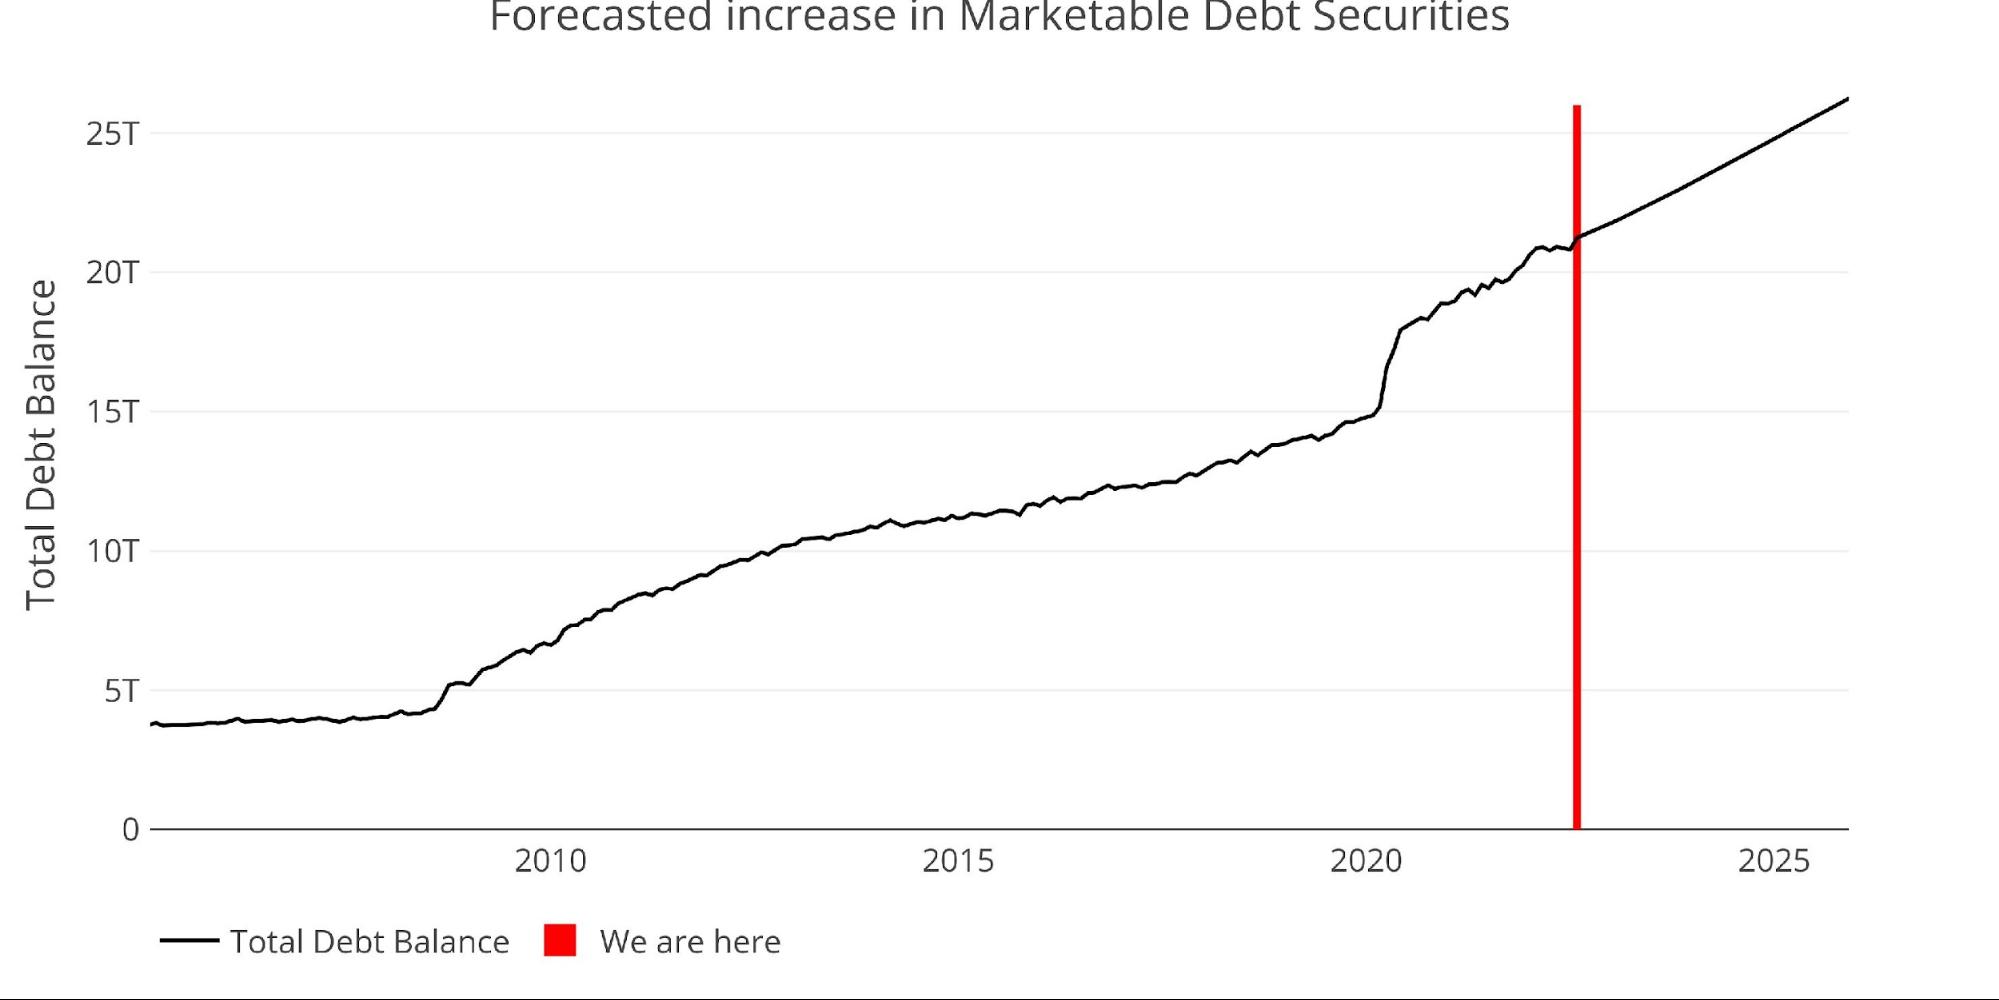
Figure: 3 The Debt Forecast
But wait. At every meeting, the Fed has gotten more hawkish. What if they dial things up again? They just went “all-in” at the September meeting. What if their next move is to pull out their car keys and drop them into the pot?
Let’s run this as an alternate scenario. Let’s assume that inflation is still high in 12 months and 5% rates are not enough. Instead of lowering rates back to 3%, they have to raise them up to 6% over the following year.
This is not a low-probability scenario. This is a very real risk. In this scenario, the Treasury is paying $1.17T per year just on interest by 2025. Yes, that is about $900B a year more than they were paying in 2021, or more than 4X higher!
This is a runaway freight train that will decimate the Federal budget, not to mention the entire economy. But don’t worry, the Fed is committed and “will do whatever it takes to get inflation back to 2%”. Yeah, okay – I will take one more look at the chart below and call that bluff ALL DAY LONG.
(Click on image to enlarge)
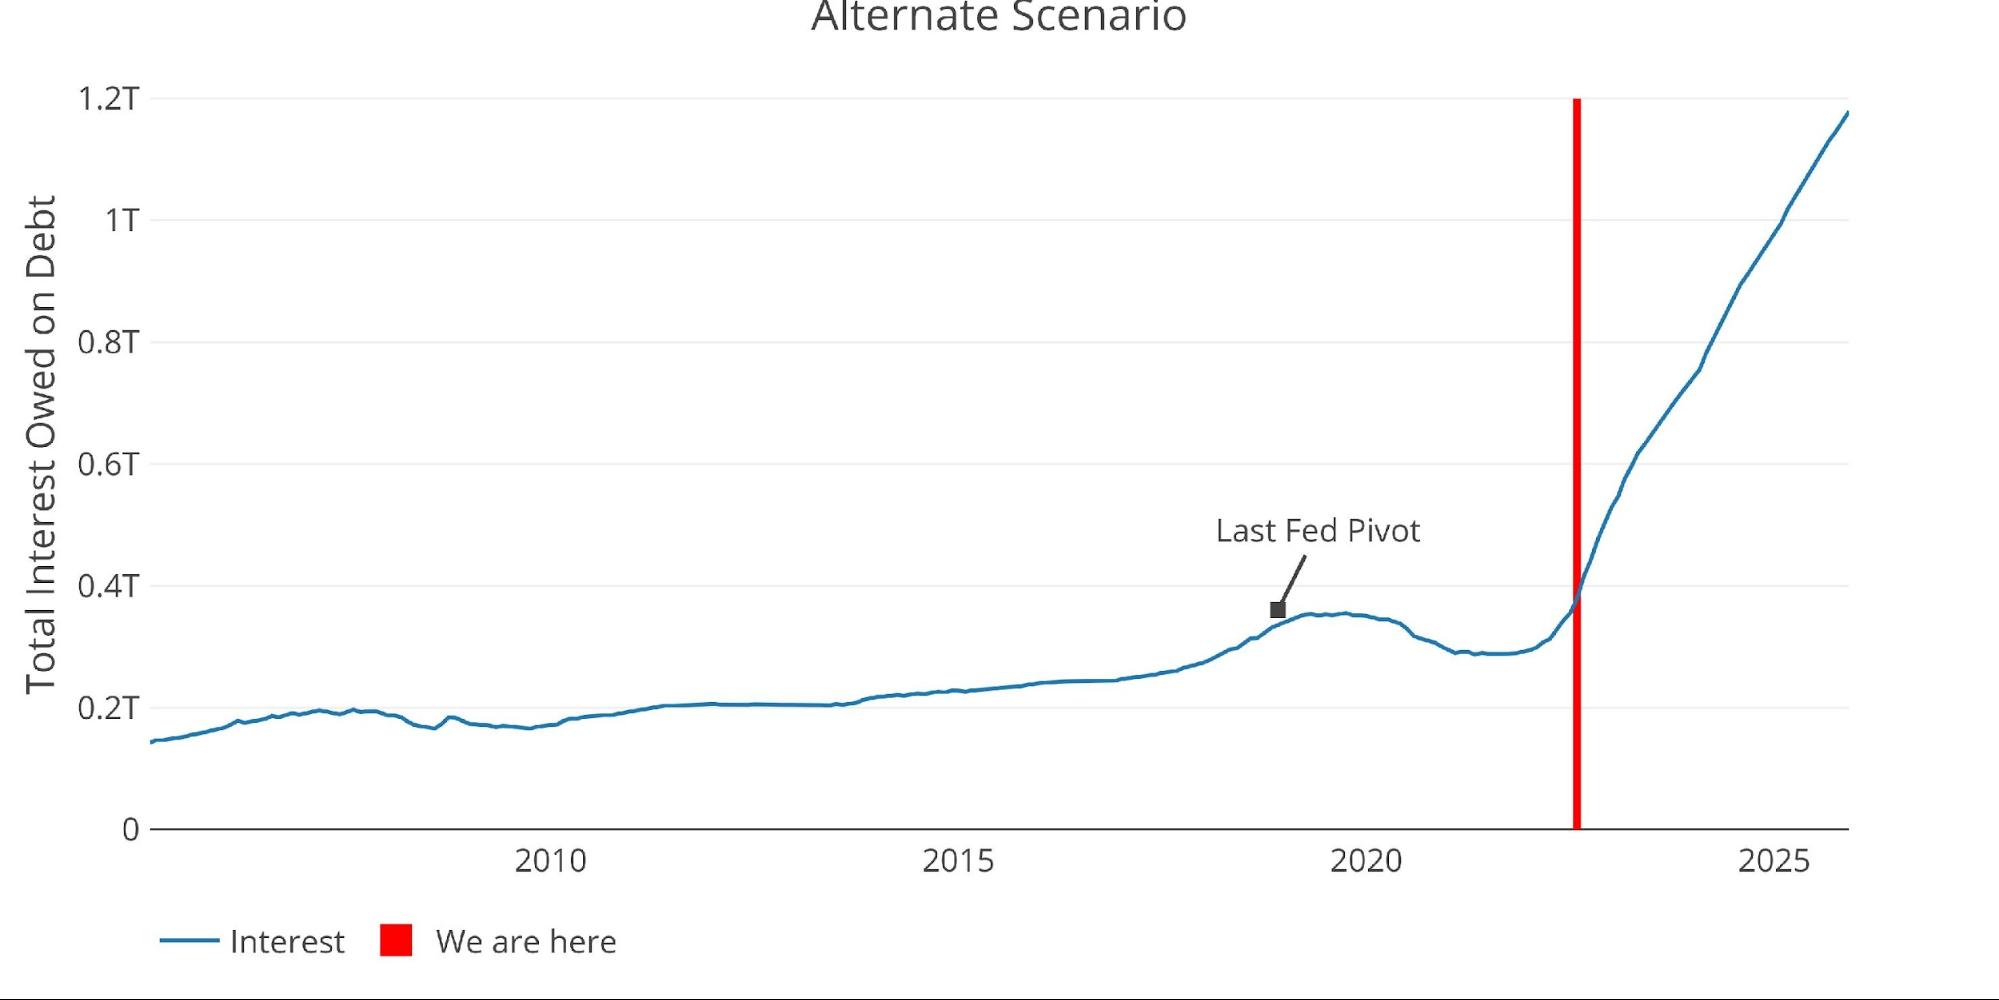
Figure: 4 The Interest Forecast – Alternate Scenario
I know what you’re thinking “Wow, that is one ugly chart!”
Oh, but wait, it gets worse.
Remember that this calculation is done on just Bills, Bonds, and Notes. This calculation had been a good proxy for total interest owed on the debt which also includes things like I-Bonds, Tips, Non-marketable debt, etc. This can be seen in the next chart below where the black line tracked nicely with the bar chart. The black line is pulled direct from the Treasury Monthly Statement. That is the actual interest paid as reported by the Treasury.
As you can see, the black line has pulled away from the calculated interest starting with Covid. The Treasury is paying a lot more interest across many different instruments. Unfortunately, the data provided via the treasury API is not good enough to run this calculation on the other instruments.
My point is that the above scenarios are underestimates. They only consider one portion of the debt, albeit the biggest portion, but actual interest is rising even faster!
(Click on image to enlarge)
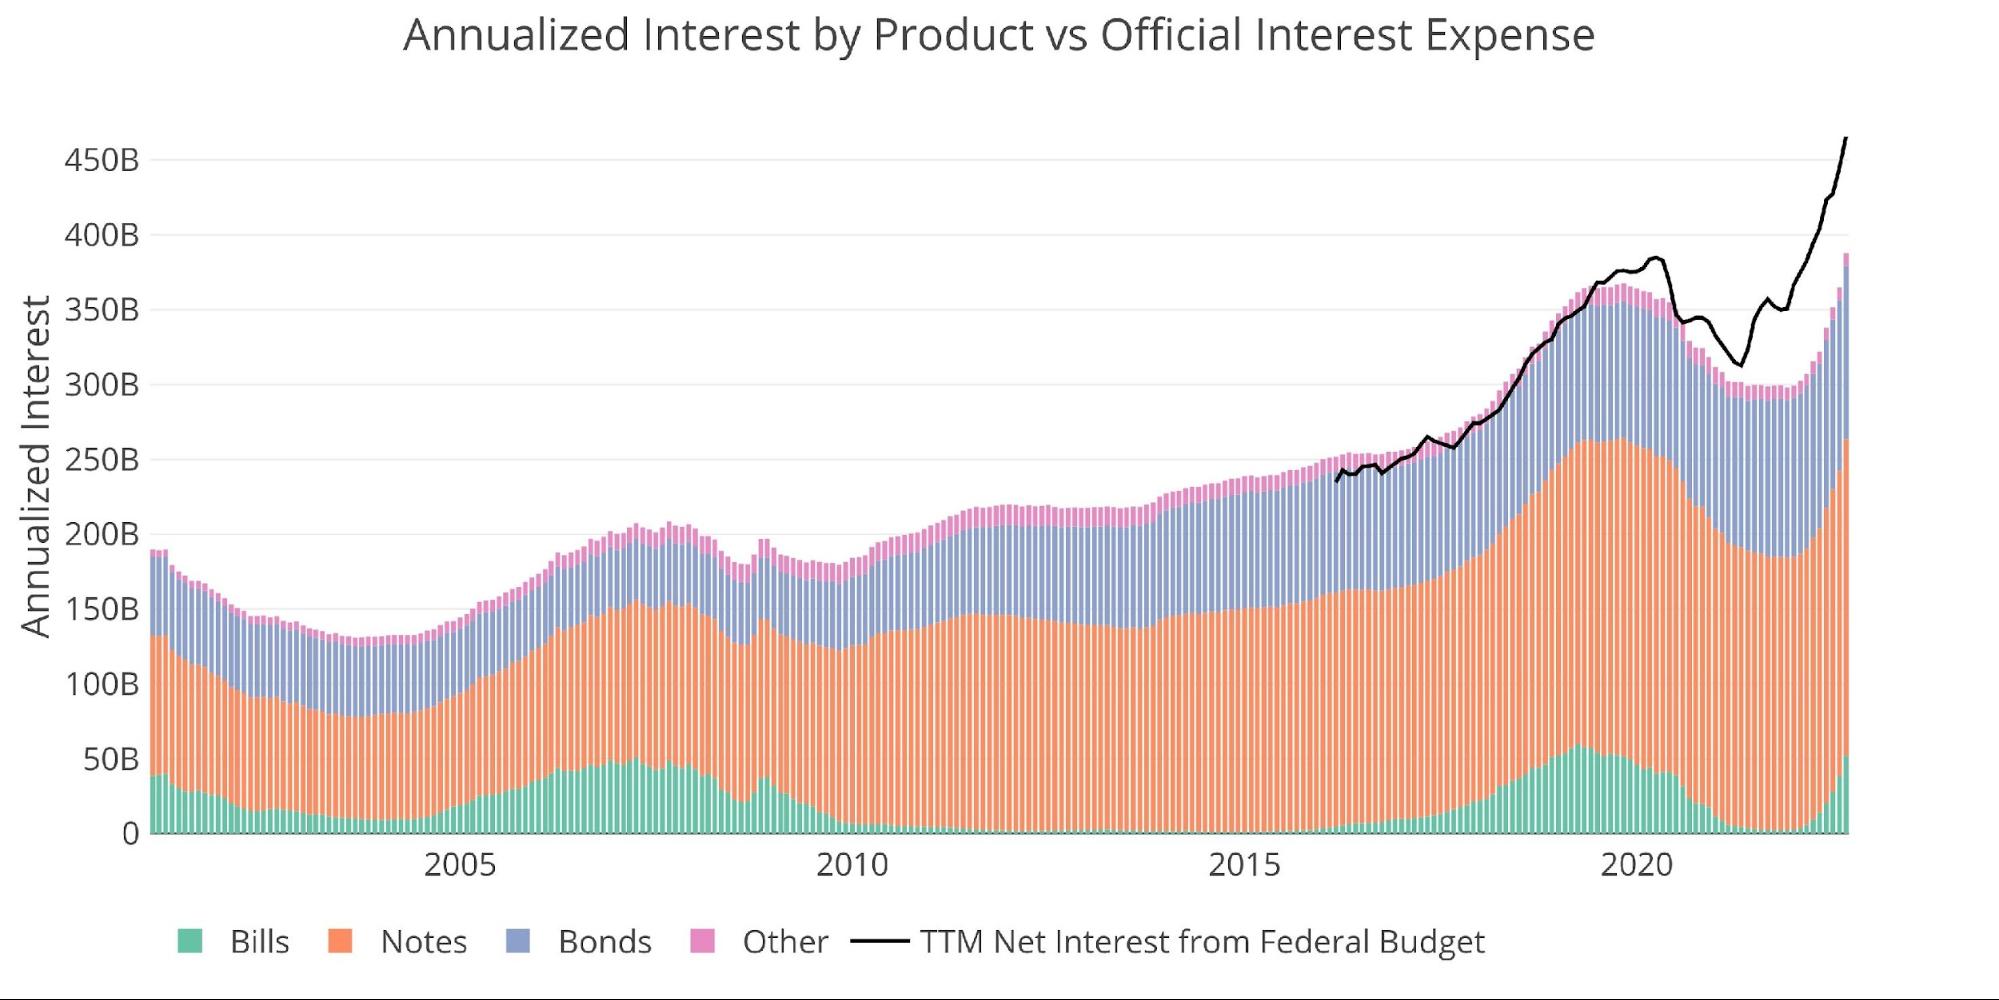
Figure: 5 Net Interest Expense
So, what’s my point?
When you are deep in a hole and your cards are terrible, you have two choices. You can fold or bluff. If you bluff, you must do it effectively enough that you scare everyone out of the hand.
Unfortunately for the Fed, they played their hand wrong. This isn’t pre-Flop anymore. Pre-flop the Fed had horrendous cards but called. They went with “average inflation targeting”. Once that blew up in their face with a brutal flop, they checked again. This time with “inflation is transitory”. Whoops.
Then the Turn came and they realized they can’t just keep calling, they actually need to get everyone else out of the hand. So, they bluffed. They bluffed big! Unfortunately, it’s too late. Everyone is pot committed and The River is coming quickly! Just look at the charts above. Look at the red bars… this is not happening in 2-3 years. This is happening right now!
Not only is the debt spiral currently underway, but the economy now faces a slew of risks:
-
-
- What if falling liquidity in the bond market creates a spike in rates?
- What if the recession causes tax revenues to fall and borrowing to increase?
- What if the recession gets worse?
- What if China invades Taiwan?
- What if a corporate bankruptcy sets off a domino effect?
- What if the housing market falls due to spiking mortgage rates?
- What if the completely lopsided long-dollar trade unravels?
- What if the long-dollar trade continues and foreign currencies start to collapse?
- What if inflation doesn’t come down?
- What if the financial markets freeze because there is a credit event somewhere?
- What if the market cannot absorb all the new debt issuance and rates go up even more?
- What if Congress responds to any of these possibilities with more spending?
- What if new debt exceeds $1.2T a year?
-
None of these hypotheticals are far-fetched. I would argue each has a ~50% probability. That means the odds of none of these things happening is 0.02%. Said differently, there is a 99.98% chance that something besides the debt spiral also blows up. So, when one of these events does happen, the alternate scenario in Figure 4 becomes the best-case scenario. Remember that one? Where the Treasury is spending over $1T a year on interest? That’s called Game Over.
There is absolutely no way the Fed will sit by and continue raising rates, but somehow the Fed has the market convinced they are in control and will not pivot too early. The Fed has bluffed as hard as they possibly can. They have thrown the entire currency market into chaos. Even if they don’t care about foreign currencies or the economy, they cannot escape the laws of math. They have less than 6 months, 12 months tops. Either they pivot or the Treasury enters a debt spiral and the economy follows suit.
I get that Europe is a mess and China’s real estate market is falling apart. The Pound and Yen are both crashing. But just because all the boats around you are sinking faster than yours doesn’t mean you are safe. Get on board a real safe haven like gold or silver.
The physical gold and silver market can see what’s coming. That’s why deliveries are spiking and metal is flooding out of the vaults. The paper market looks depressed, but the physical market is a few steps ahead.
They don’t ring bells at the top or bottom, but right now the math is ringing the bell pretty darn loud. Are you paying attention?
US Debt interactive charts and graphs can always be found on the Exploring Finance dashboard: https://exploringfinance.shinyapps.io/USDebt/
More By This Author:
Comex Update: September Gold Delivery Volume Blasts Higher
Feel The Pain
Atlanta Fed Lowers Q3 GDP Growth Forecast Close To Zero


