Published
1 year ago on
September 29, 2022

BTC/USD Seeks More Gains: Sally Ho’s Technical Analysis – 30 September 2022
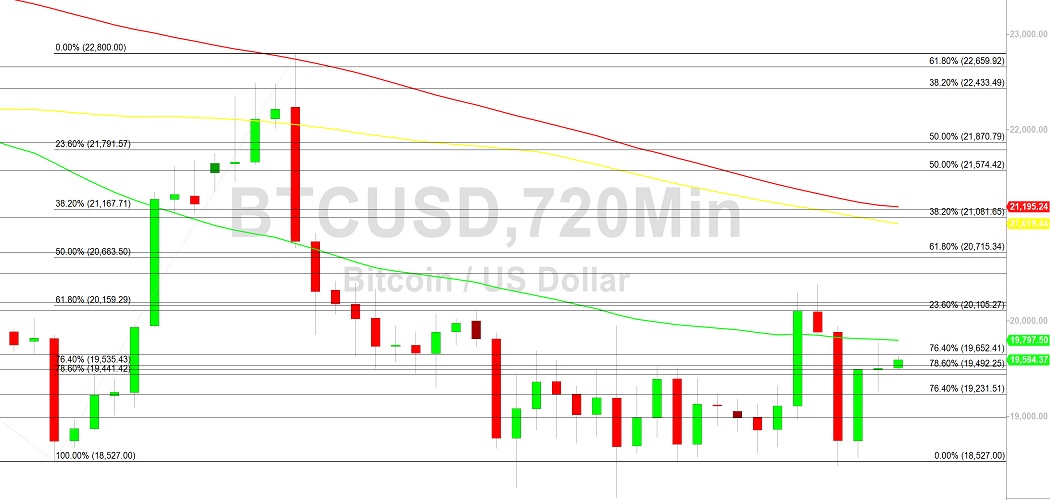
Bitcoin (BTC/USD) worked to add to recent gains early in the Asian session as the pair traded back above the 19249.79 level, representing the 23.6% retracement of the depreciating range from 22800 to 18153.13. Traders lifted BTC/USD to the 19773.67 level before some selling pressure emerged to knock the pair lower to the 19278 area. Upside retracement levels in recent depreciating ranges include the 20476, 21024, 21703, and 21805 areas. Following recent selling pressure, BTC/USD bears are eyeing a greater risk of a test of the 17567.45 low reached in June. Following the recent sharp decline, the 20433 area has emerged as an area of consistent technical resistance and is technically related to selling pressure that commenced around the all-time high of 69000.
Below current price activity, traders continue to anticipate large Stops below the 17803, 17701, 16966, and 16503 areas, significant technical levels related to historical upside pressure around the 3858 and 9819 areas. Additional significant technical areas on the downside include the 16990.14, 14500.15, and 10432.73 areas. Above recent price activity, upside retracement levels in the depreciating range from 31549.21 to 17567.45 include the 26208, 28249, and 28557 areas. Additional upside price objectives and areas of potential selling pressure include the 25552, 26323, 26411, 26901, 27126, 27455, 28426, and 29669 areas. Traders are observing that the 50-bar MA (4-hourly) is bearishly indicating below the 100-bar MA (4-hourly) and below the 200-bar MA (4-hourly). Also, the 50-bar MA (hourly) is bullishly indicating above the 100-bar MA (hourly) and above the 200-bar MA (hourly).
Price activity is nearest the 100-bar MA (4-hourly) at 19722.36 and the 50-bar MA (Hourly) at 19420.63.
Technical Support is expected around 16990.14/ 14500.15/ 10432.73 with Stops expected below.
Technical Resistance is expected around 25256.96/ 27455.20/ 32383.96 with Stops expected above.
On 4-Hourly chart, SlowK is Bullishly above SlowD while MACD is Bullishly above MACDAverage.
On 60-minute chart, SlowK is Bearishly below SlowD while MACD is Bullishly above MACDAverage.
Disclaimer: Sally Ho’s Technical Analysis is provided by a third party, and for informational purposes only. It does not reflect the views of Crypto Daily, nor is it intended to be used as legal, tax, investment, or financial advice.
Investment DisclaimerHalving Hype: Runes Protocol Poised to Reshape Bitcoin's Token Economy
Bitcoin is finished? Think again