
Metals Speculators Continued To Trim Gold Bets To 179-Week Low
Here are the latest charts and statistics for the Commitment of Traders (COT) data published by the Commodities Futures Trading Commission (CFTC).
The latest COT data is updated through Tuesday September 27th and shows a quick view of how large traders (for-profit speculators and commercial entities) were positioned in the futures markets.
Weekly Speculator Changes led by Silver & Palladium
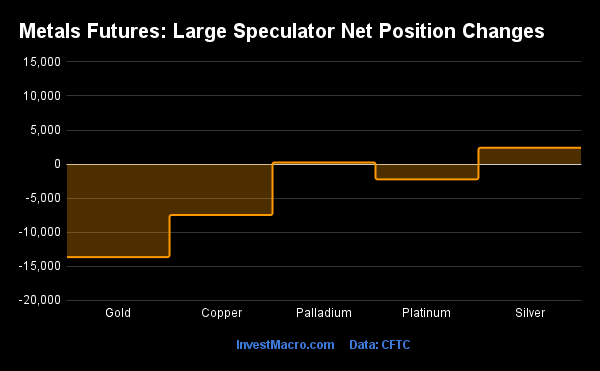
The COT precious metals speculator bets were slightly lower this week as two out of the five metals markets we cover had higher positioning this week while three markets had lower contracts.
Leading the gains for the precious metals markets was Silver (2,398 contracts) with Palladium (250 contracts) showing a small positive week.
The metals markets leading the declines in speculator bets this week were Gold (-13,641 contracts) and Copper (-7,470 contracts) with Platinum (-2,229 contracts) also registering lower bets on the week.
Highlighting the COT Metals data continues to be the downtrend of the Gold speculator positioning. Speculators dropped their Gold bets for the seventh consecutive week this week and that has now diminished the bullish Gold speculator position by a total of -90,770 contracts over the past 7-week period. This sentiment decline has pushed the overall Gold speculator standing (currently at +52,081 contracts) down to the lowest level of the past 179 weeks, dating back to April 23rd of 2019.
The Gold spot price has been in a downtrend in the second half of this year and has fallen by approximately 20 percent since reaching a high of approximately $2070.60 in March. This week saw the Gold price bounce off the $1615 support level to finish the week over 1 percent higher.
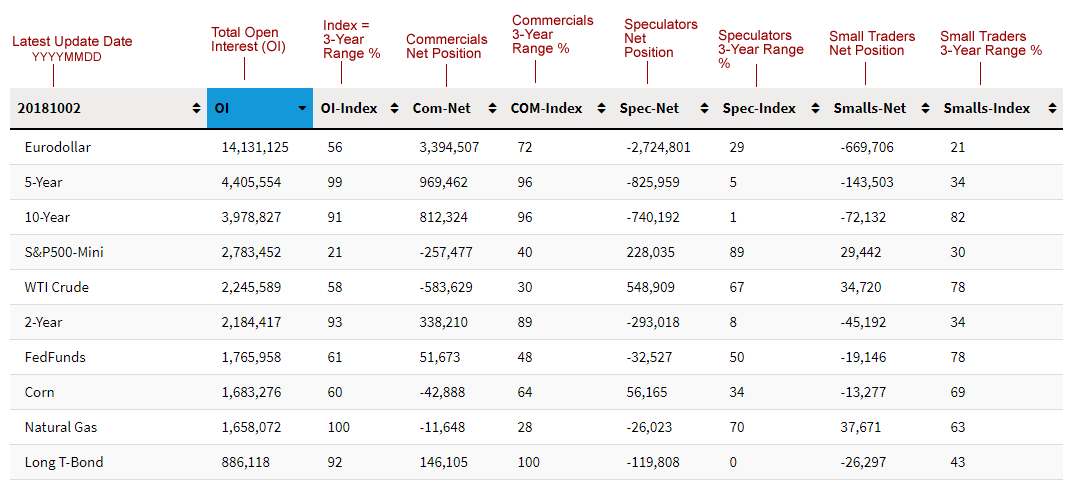
Data Snapshot of Commodity Market Traders | Columns Legend
| WTI Crude | 1,504,991 | 3 | 226,080 | 4 | -246,872 | 98 | 20,792 | 35 |
| Corn | 1,347,278 | 11 | 296,622 | 68 | -229,436 | 39 | -67,186 | 4 |
| Natural Gas | 943,241 | 0 | -152,124 | 33 | 121,135 | 69 | 30,989 | 54 |
| Sugar | 710,887 | 2 | 48,601 | 47 | -56,409 | 57 | 7,808 | 18 |
| Soybeans | 699,311 | 27 | 80,051 | 38 | -50,206 | 71 | -29,845 | 21 |
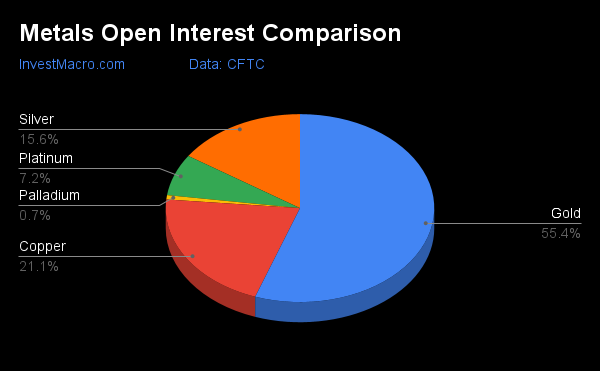
| Gold | 457,061 | 1 | 52,081 | 0 | -62,138 | 100 | 10,057 | 1 |
| Wheat | 290,771 | 2 | 2,735 | 23 | 4,675 | 66 | -7,410 | 72 |
| Heating Oil | 290,265 | 31 | 11,414 | 59 | -21,625 | 48 | 10,211 | 34 |
| Coffee | 185,149 | 1 | 44,680 | 77 | -46,664 | 27 | 1,984 | 18 |
| Copper | 173,661 | 13 | -27,756 | 16 | 28,884 | 86 | -1,128 | 19 |
| Brent | 167,444 | 14 | -41,257 | 42 | 40,490 | 61 | 767 | 20 |
| Silver | 129,000 | 0 | 758 | 15 | -6,860 | 89 | 6,102 | 0 |
| Platinum | 58,994 | 20 | 161 | 9 | -2,525 | 93 | 2,364 | 0 |
| Palladium | 6,080 | 1 | -831 | 18 | 1,236 | 82 | -405 | 20 |
Strength Scores
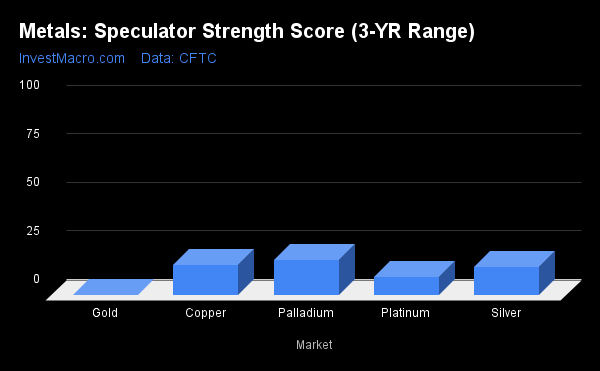
Strength scores (a measure of the 3-Year range of Speculator positions, from 0 to 100 where above 80 is extreme bullish and below 20 is extreme bearish) showed that Palladium (18.2 percent) took the lead with the highest current score in the metals category (Copper had led the past bunch of months).
The metals category continues to have a very rough time in this investing environment and the speculators sentiment continues to be lacking as all five of the metals markets are in bearish extreme levels with scores below 20 percent.
The lowest scores are led by Gold at 0.0 percent (at the bottom of its 3-year range) and is followed by Platinum (9.3 percent), Silver (14.9 percent) and Copper (15.9 percent).
Strength Statistics:
Gold (0.0 percent) vs Gold previous week (4.5 percent)
Silver (14.9 percent) vs Silver previous week (12.3 percent)
Copper (15.9 percent) vs Copper previous week (21.7 percent)
Platinum (9.3 percent) vs Platinum previous week (12.3 percent)
Palladium (18.2 percent) vs Palladium previous week (16.8 percent)
Strength Trends
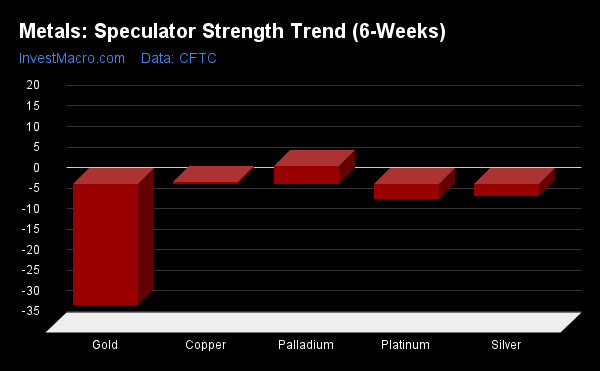
Strength Score Trends (or move index, calculates the 6-week changes in strength scores) showed that Palladium (4.3 percent) leads the past six weeks trends for metals this week. Copper (0.4 percent) fills out the only other positive mover in the latest trends data.
Gold (-29.5 percent) leads the downside trend scores currently while the next market with lower trend scores were the Platinum (-3.7 percent) followed by Silver (-3.0 percent).
Move Statistics:
Gold (-29.5 percent) vs Gold previous week (-25.6 percent)
Silver (-3.0 percent) vs Silver previous week (-5.0 percent)
Copper (0.4 percent) vs Copper previous week (6.4 percent)
Platinum (-3.7 percent) vs Platinum previous week (2.1 percent)
Palladium (4.3 percent) vs Palladium previous week (5.0 percent)
Individual Markets:
Gold Comex Futures:
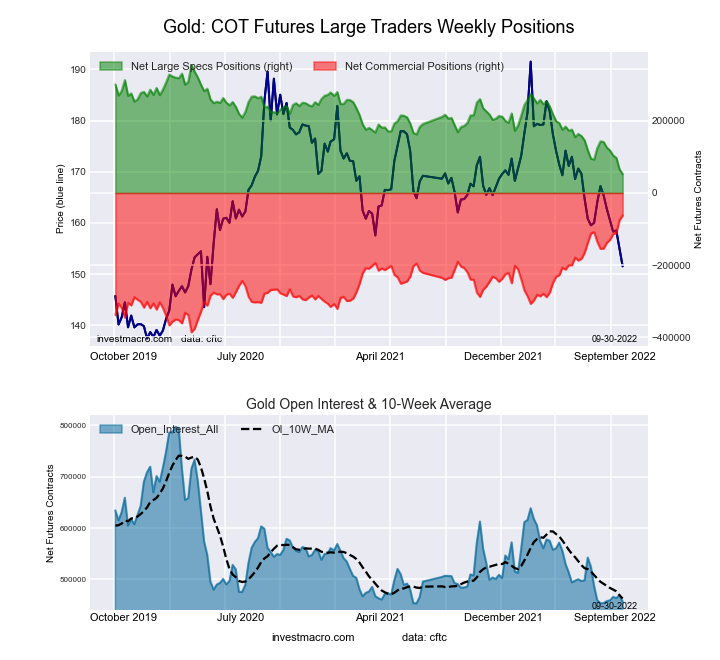
The Gold Comex Futures large speculator standing this week resulted in a net position of 52,081 contracts in the data reported through Tuesday. This was a weekly decrease of -13,641 contracts from the previous week which had a total of 65,722 net contracts.
This week’s current strength score (the trader positioning range over the past three years, measured from 0 to 100) shows the speculators are currently Bearish-Extreme with a score of 0.0 percent. The commercials are Bullish-Extreme with a score of 100.0 percent and the small traders (not shown in chart) are Bearish-Extreme with a score of 0.9 percent.
| Gold Futures Statistics | SPECULATORS | COMMERCIALS | SMALL TRADERS |
| – Percent of Open Interest Longs: | 45.3 | 30.5 | 8.8 |
| – Percent of Open Interest Shorts: | 33.9 | 44.1 | 6.6 |
| – Net Position: | 52,081 | -62,138 | 10,057 |
| – Gross Longs: | 207,154 | 139,361 | 40,325 |
| – Gross Shorts: | 155,073 | 201,499 | 30,268 |
| – Long to Short Ratio: | 1.3 to 1 | 0.7 to 1 | 1.3 to 1 |
| NET POSITION TREND: | |||
| – Strength Index Score (3 Year Range Pct): | 0.0 | 100.0 | 0.9 |
| – Strength Index Reading (3 Year Range): | Bearish-Extreme | Bullish-Extreme | Bearish-Extreme |
| NET POSITION MOVEMENT INDEX: | |||
| – 6-Week Change in Strength Index: | -29.5 | 28.3 | -6.5 |
Silver Comex Futures:
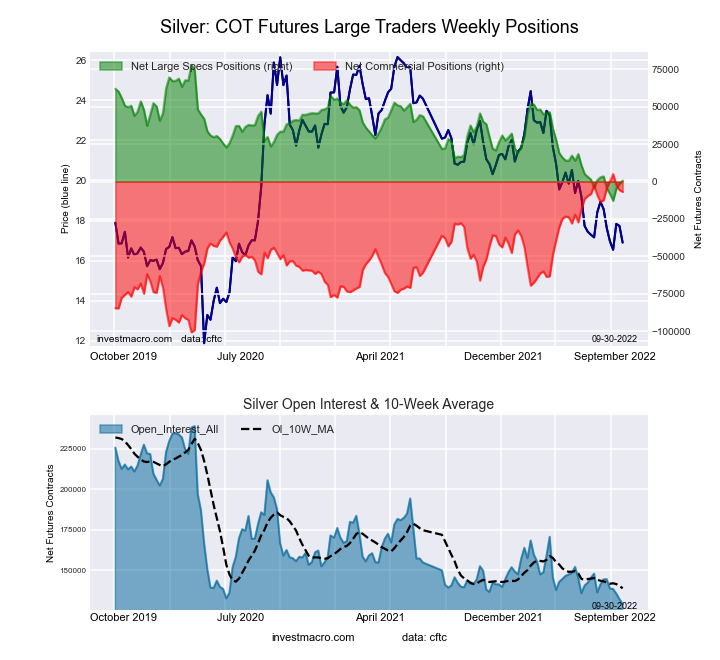
The Silver Comex Futures large speculator standing this week resulted in a net position of 758 contracts in the data reported through Tuesday. This was a weekly boost of 2,398 contracts from the previous week which had a total of -1,640 net contracts.
This week’s current strength score (the trader positioning range over the past three years, measured from 0 to 100) shows the speculators are currently Bearish-Extreme with a score of 14.9 percent. The commercials are Bullish-Extreme with a score of 88.7 percent and the small traders (not shown in chart) are Bearish-Extreme with a score of 0.0 percent.
| Silver Futures Statistics | SPECULATORS | COMMERCIALS | SMALL TRADERS |
| – Percent of Open Interest Longs: | 38.7 | 38.0 | 16.0 |
| – Percent of Open Interest Shorts: | 38.2 | 43.3 | 11.3 |
| – Net Position: | 758 | -6,860 | 6,102 |
| – Gross Longs: | 49,984 | 48,993 | 20,681 |
| – Gross Shorts: | 49,226 | 55,853 | 14,579 |
| – Long to Short Ratio: | 1.0 to 1 | 0.9 to 1 | 1.4 to 1 |
| NET POSITION TREND: | |||
| – Strength Index Score (3 Year Range Pct): | 14.9 | 88.7 | 0.0 |
| – Strength Index Reading (3 Year Range): | Bearish-Extreme | Bullish-Extreme | Bearish-Extreme |
| NET POSITION MOVEMENT INDEX: | |||
| – 6-Week Change in Strength Index: | -3.0 | 5.3 | -13.6 |
Copper Grade #1 Futures:
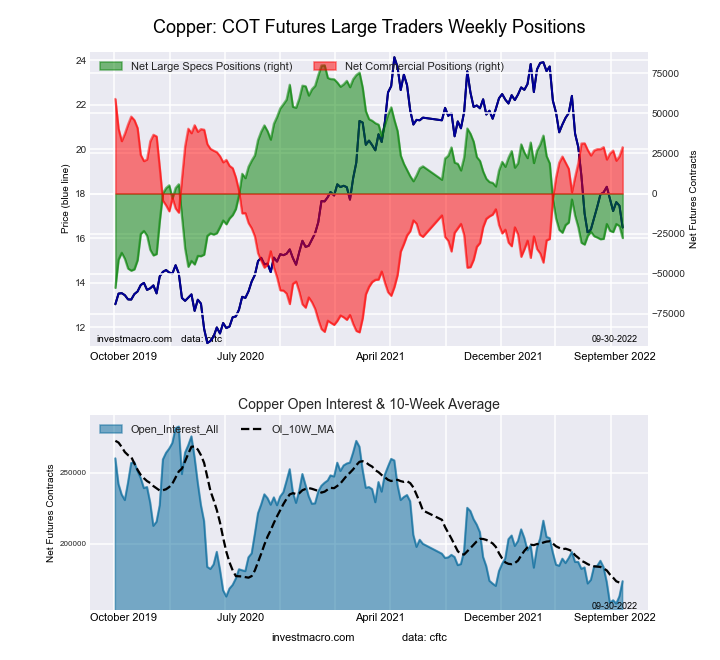
The Copper Grade #1 Futures large speculator standing this week resulted in a net position of -27,756 contracts in the data reported through Tuesday. This was a weekly lowering of -7,470 contracts from the previous week which had a total of -20,286 net contracts.
This week’s current strength score (the trader positioning range over the past three years, measured from 0 to 100) shows the speculators are currently Bearish-Extreme with a score of 15.9 percent. The commercials are Bullish-Extreme with a score of 85.8 percent and the small traders (not shown in chart) are Bearish-Extreme with a score of 18.8 percent.
| Copper Futures Statistics | SPECULATORS | COMMERCIALS | SMALL TRADERS |
| – Percent of Open Interest Longs: | 29.2 | 50.2 | 8.4 |
| – Percent of Open Interest Shorts: | 45.2 | 33.6 | 9.1 |
| – Net Position: | -27,756 | 28,884 | -1,128 |
| – Gross Longs: | 50,726 | 87,188 | 14,608 |
| – Gross Shorts: | 78,482 | 58,304 | 15,736 |
| – Long to Short Ratio: | 0.6 to 1 | 1.5 to 1 | 0.9 to 1 |
| NET POSITION TREND: | |||
| – Strength Index Score (3 Year Range Pct): | 15.9 | 85.8 | 18.8 |
| – Strength Index Reading (3 Year Range): | Bearish-Extreme | Bullish-Extreme | Bearish-Extreme |
| NET POSITION MOVEMENT INDEX: | |||
| – 6-Week Change in Strength Index: | 0.4 | -0.0 | -2.4 |
Platinum Futures:
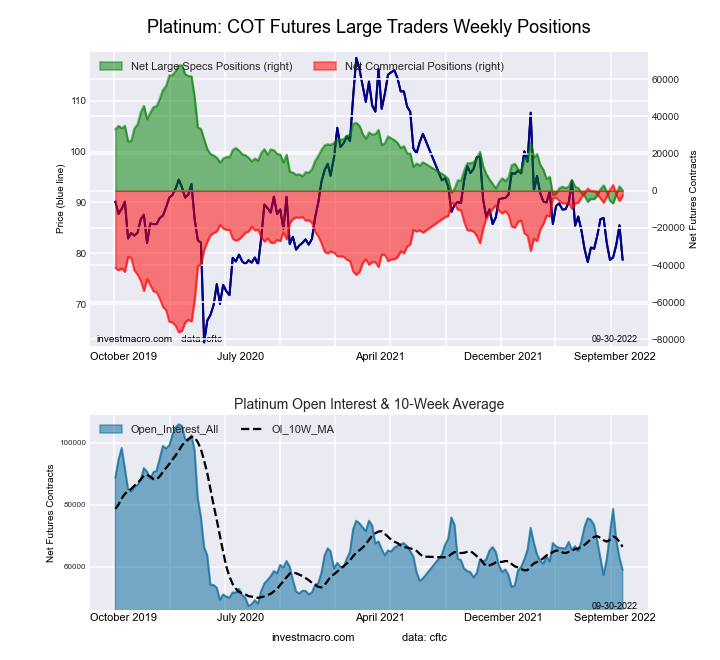
The Platinum Futures large speculator standing this week resulted in a net position of 161 contracts in the data reported through Tuesday. This was a weekly fall of -2,229 contracts from the previous week which had a total of 2,390 net contracts.
This week’s current strength score (the trader positioning range over the past three years, measured from 0 to 100) shows the speculators are currently Bearish-Extreme with a score of 9.3 percent. The commercials are Bullish-Extreme with a score of 92.8 percent and the small traders (not shown in chart) are Bearish-Extreme with a score of 0.0 percent.
| Platinum Futures Statistics | SPECULATORS | COMMERCIALS | SMALL TRADERS |
| – Percent of Open Interest Longs: | 40.6 | 42.3 | 11.3 |
| – Percent of Open Interest Shorts: | 40.3 | 46.6 | 7.3 |
| – Net Position: | 161 | -2,525 | 2,364 |
| – Gross Longs: | 23,944 | 24,942 | 6,675 |
| – Gross Shorts: | 23,783 | 27,467 | 4,311 |
| – Long to Short Ratio: | 1.0 to 1 | 0.9 to 1 | 1.5 to 1 |
| NET POSITION TREND: | |||
| – Strength Index Score (3 Year Range Pct): | 9.3 | 92.8 | 0.0 |
| – Strength Index Reading (3 Year Range): | Bearish-Extreme | Bullish-Extreme | Bearish-Extreme |
| NET POSITION MOVEMENT INDEX: | |||
| – 6-Week Change in Strength Index: | -3.7 | 4.8 | -14.1 |
Palladium Futures:
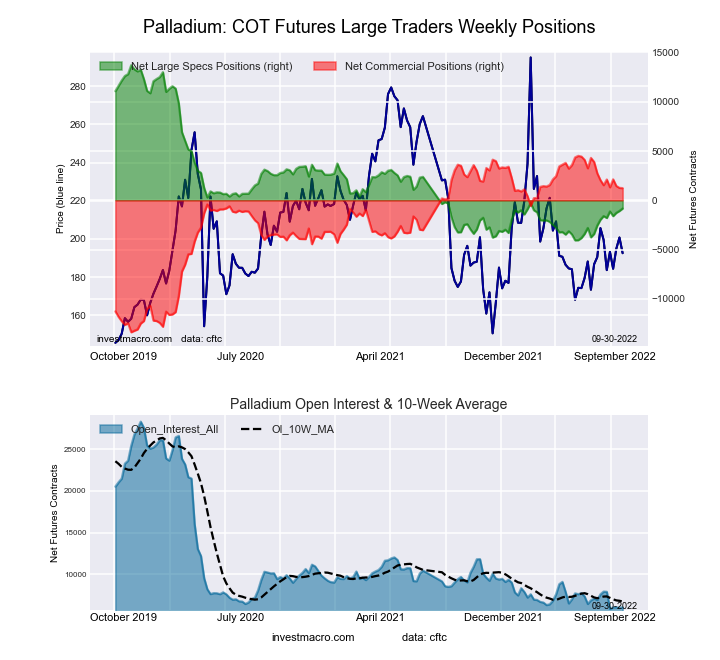
The Palladium Futures large speculator standing this week resulted in a net position of -831 contracts in the data reported through Tuesday. This was a weekly advance of 250 contracts from the previous week which had a total of -1,081 net contracts.
This week’s current strength score (the trader positioning range over the past three years, measured from 0 to 100) shows the speculators are currently Bearish-Extreme with a score of 18.2 percent. The commercials are Bullish-Extreme with a score of 81.7 percent and the small traders (not shown in chart) are Bearish with a score of 20.4 percent.
| Palladium Futures Statistics | SPECULATORS | COMMERCIALS | SMALL TRADERS |
| – Percent of Open Interest Longs: | 25.0 | 57.9 | 15.2 |
| – Percent of Open Interest Shorts: | 38.7 | 37.6 | 21.8 |
| – Net Position: | -831 | 1,236 | -405 |
| – Gross Longs: | 1,519 | 3,523 | 922 |
| – Gross Shorts: | 2,350 | 2,287 | 1,327 |
| – Long to Short Ratio: | 0.6 to 1 | 1.5 to 1 | 0.7 to 1 |
| NET POSITION TREND: | |||
| – Strength Index Score (3 Year Range Pct): | 18.2 | 81.7 | 20.4 |
| – Strength Index Reading (3 Year Range): | Bearish-Extreme | Bullish-Extreme | Bearish |
| NET POSITION MOVEMENT INDEX: | |||
| – 6-Week Change in Strength Index: | 4.3 | -1.7 | -27.1 |
*COT Report: The COT data, released weekly to the public each Friday, is updated through the most recent Tuesday (data is 3 days old) and shows a quick view of how large speculators or non-commercials (for-profit traders) were positioned in the futures markets.
The CFTC categorizes trader positions according to commercial hedgers (traders who use futures contracts for hedging as part of the business), non-commercials (large traders who speculate to realize trading profits) and nonreportable traders (usually small traders/speculators) as well as their open interest (contracts open in the market at time of reporting). See CFTC criteria here.
More By This Author:
Soybean Meal Bullish Speculator Bets Leads Weekly COT Soft Commodities Changes
Euro Speculator Bets Go Bullish For 3rd Week To Lead The COT Changes
COT Extremes: Soybean Meal And Gold Top Bullish & Bearish Speculator Positions
Receive our weekly COT Newsletter
Disclosure: Foreign Currency trading and trading on margin carries a high level of risk and can ...
more

