Published
1 year ago on
October 04, 2022
BTC/USD Tests 19701 Resistance: Sally Ho’s Technical Analysis – 5 October 2022
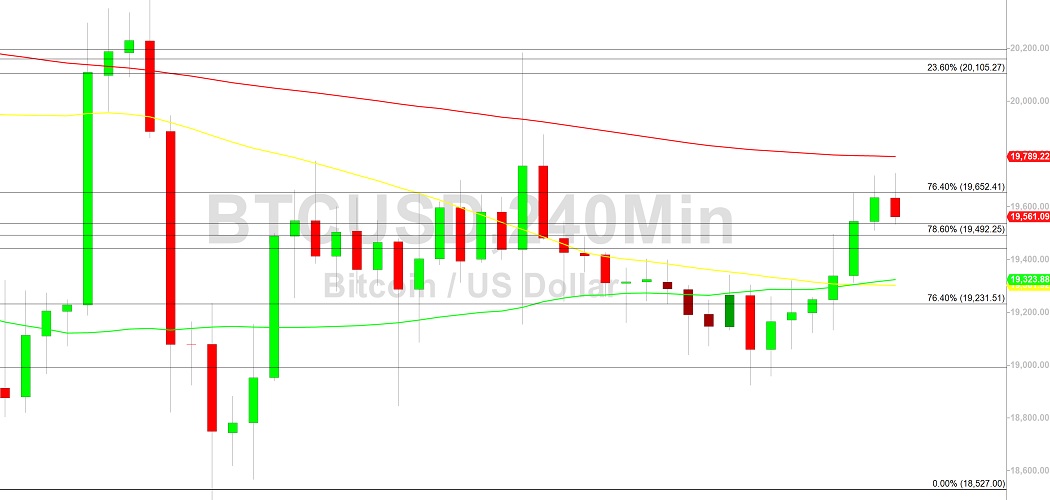
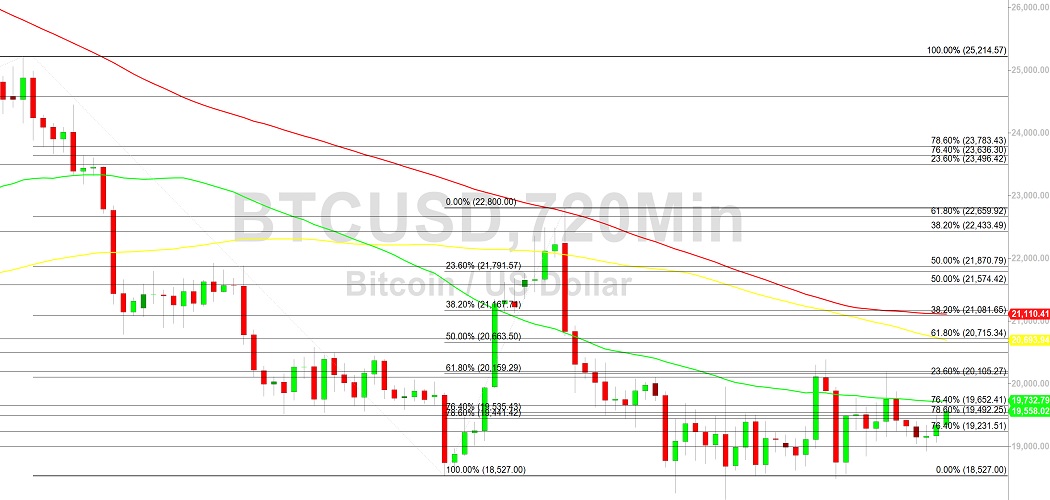
Bitcoin (BTC/USD) maintained some upward momentum early in the Asian session as the pair recently traded above the 19701.82 area, representing the 61.8% retracement of the depreciating range from 20182.72 to 18923.81. Additional upside retracement levels in this depreciating range include the 19885 and 19913 areas. Prior to reaching this level, selling pressure emerged around the 19652 area, right around a technical level related to buying pressure that emerged around the 17934 area in June.Upside retracement levels in recent depreciating ranges include the 20476, 21024, 21703, and 21805 areas. Following recent selling pressure, BTC/USD bears are eyeing a greater risk of a test of June lows. Following the recent sharp decline, the 20433 area has emerged as an area of consistent technical resistance and is technically related to selling pressure that commenced around the all-time high of 69000.
Below current price activity, traders continue to anticipate large Stops below the 17803, 17701, 16966, and 16503 areas, significant technical levels related to historical upside pressure around the 3858 and 9819 areas. Additional significant technical areas on the downside include the 16990.14, 14500.15, and 10432.73 areas. Above recent price activity, upside retracement levels in the depreciating range from 31549.21 to 17567.45 include the 26208, 28249, and 28557 areas. Additional upside price objectives and areas of potential selling pressure include the 25552, 26323, 26411, 26901, 27126, 27455, 28426, and 29669 areas. Traders are observing that the 50-bar MA (4-hourly) is bearishly indicating below the 200-bar MA (4-hourly) and above the 100-bar MA (4-hourly). Also, the 50-bar MA (hourly) is bearishly indicating below the 100-bar MA (hourly) and below the 200-bar MA (hourly).
Price activity is nearest the 200-bar MA (4-hourly) at 19789.24 and the 100-bar MA (Hourly) at 19361.97.
Technical Support is expected around 16990.14/ 14500.15/ 10432.73 with Stops expected below.
Technical Resistance is expected around 25256.96/ 27455.20/ 32383.96 with Stops expected above.
On 4-Hourly chart, SlowK is Bullishly above SlowD while MACD is Bullishly above MACDAverage.
On 60-minute chart, SlowK is Bearishly below SlowD while MACD is Bullishly above MACDAverage.
Disclaimer: Sally Ho’s Technical Analysis is provided by a third party, and for informational purposes only. It does not reflect the views of Crypto Daily, nor is it intended to be used as legal, tax, investment, or financial advice.
Investment DisclaimerDexalot Brings Its CEX-Like DEX Trading Platform To Ethereum L2 Arbitrum
Bitcoin grinds higher despite Mt Gox $9 billion BTC payout overhang