
AUD/USD Eyes Australian Retail Sales And China PMI Data As Iron Ore Prices Pose Headwind
Monday’s Asia-Pacific Outlook
Asia-Pacific stocks outside of China advanced last week as bond buyers returned to the market, pushing yields lower. Japan’s Nikkei 225 rose 0.8%, and South Korea’s KOSPI Index put in a 2.5% gain. Chinese stocks were heavily sold in the first week of trading after President Xi Jinping secured a third term. Investors were spooked by his consolidation of power, with moderate voices largely absent from his new inner circle.
An increase in Covid cases across China prompted new lockdown measures across dozens of cities. Zhengzhou saw its iPhone-making factory enter a closed-loop system, which bars certain employees from leaving. Foxconn operates the factory that is currently producing the newest iPhone. Apple rose over 7% in US trading on Friday despite the news.
Iron ore prices in Singapore fell below $80 for the first time since early 2020. A demand pullback is slamming prices as higher rates and China’s ailing property sector curtail the need for metal. That doesn’t bode well for the Australian Dollar given Australia’s large mining sector that relies heavily on the Chinese market.
Australia’s September retail sales figure is due at 00:30 UTC. The Bloomberg consensus sees a 0.6% increase from the month prior. That will be the last data point before the Reserve Bank of Australia announces its policy decision on Tuesday. Cash rates futures are pricing a 100% chance for a 25-basis point rate hike and virtually no chance for a larger hike. Friday’s Commitment of Traders report (COT) from the CFTC revealed an increase (+15.2k) in speculator short bets on Australian Dollar currency futures.
Australian Dollar Technical Outlook
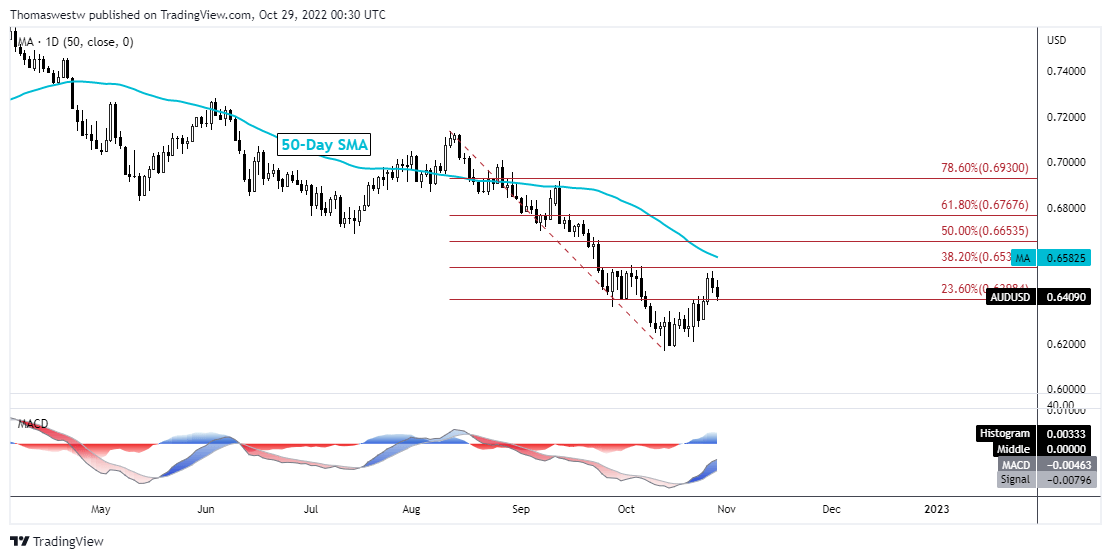
The Australian Dollar pierced above the 23.6% Fibonacci retracement on Wednesday following failed intraday attempts on Monday and Tuesday. That Fib level came back into play on Friday as support. If prices hold above the level, focus would turn to the falling 50-day Simple Moving Average (SMA) and the 38.2% Fib. The MACD is showing positive momentum toward its midpoint, but AUD/USD remains vulnerable to further losses amid the broader downtrend.
AUD/USD Daily Chart
(Click on image to enlarge)
More By This Author:
Markets Week Ahead: Dow Jones, Nasdaq 100, US Dollar, AUD/USD, GBP/USD, Fed, RBA, BoECanadian Dollar Weekly Forecast: USD/CAD Keenly Awaits FOMC After BoC Shock
US Dollar Forecast: Another Fed Jumbo Hike In Focus As Markets Bet On Policy Moderation
Disclosure: See the full disclosure for DailyFX here.


