
Bitcoin, Ethereum, Litecoin Technical Outlook: BTC, ETH, LTC Levels

Image Source: Pexels
Bitcoin Technical Analysis
Bitcoin prices are on track to end the week in the green after last weeks brutal sell-off resulted in 21.99% decline in value. With the November low setting a fresh yearly low, the dramatic shift in sentiment over the past 12 months highlights the changes in the fundamental backdrop.
With the ongoing investigation into FTX and founder Sam Bankman-Fried, BTC/USD price action has eased into a narrow range. As a doji candle forms on the weekly chart, the weekly open continues to provide psychological support at $16300 while the November low holds as the next big support level at $15632.
Bitcoin (BTC/USD) Weekly Chart
(Click on image to enlarge)
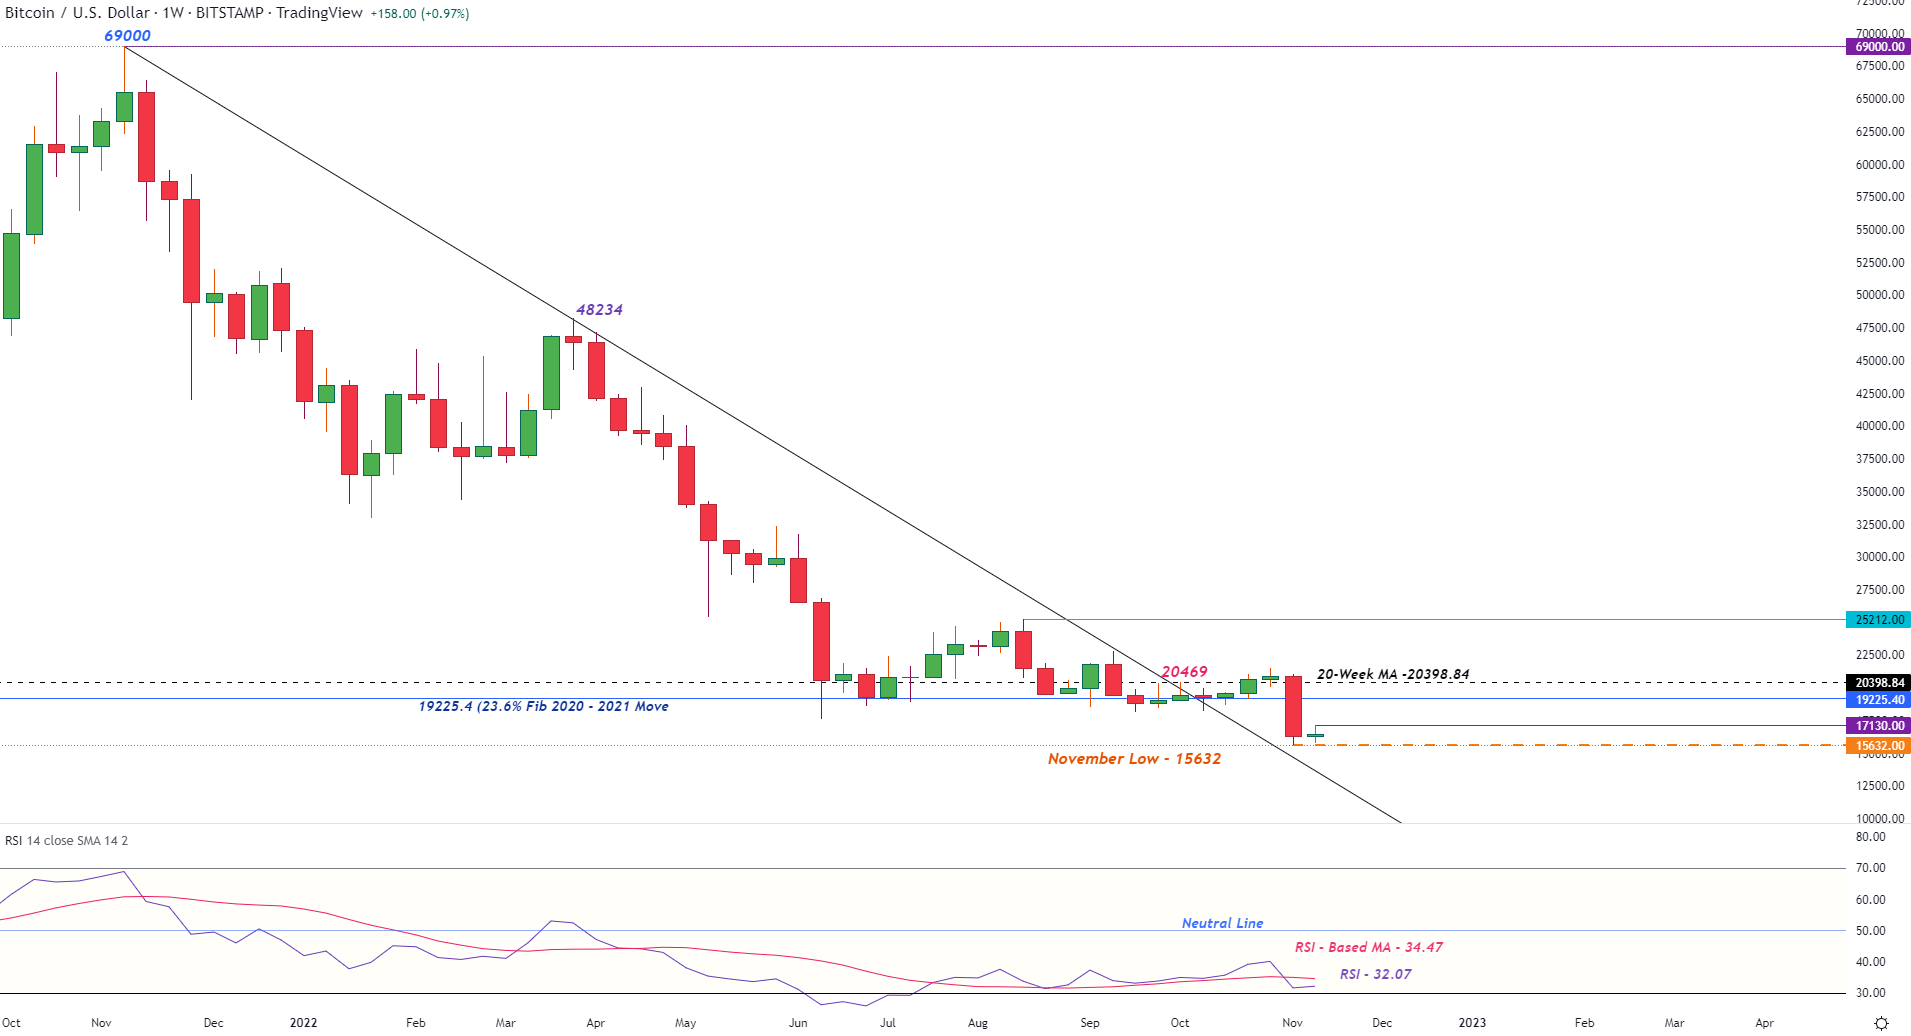
Chart prepared by Tammy Da Costa using TradingView
As the weekly RSI heads towards oversold territory, the daily chart illustrates the near-term resistance at the 13 November high of $17240 which could see BTC rise back towards $180000.
Bitcoin (BTC/USD) Daily Chart
(Click on image to enlarge)
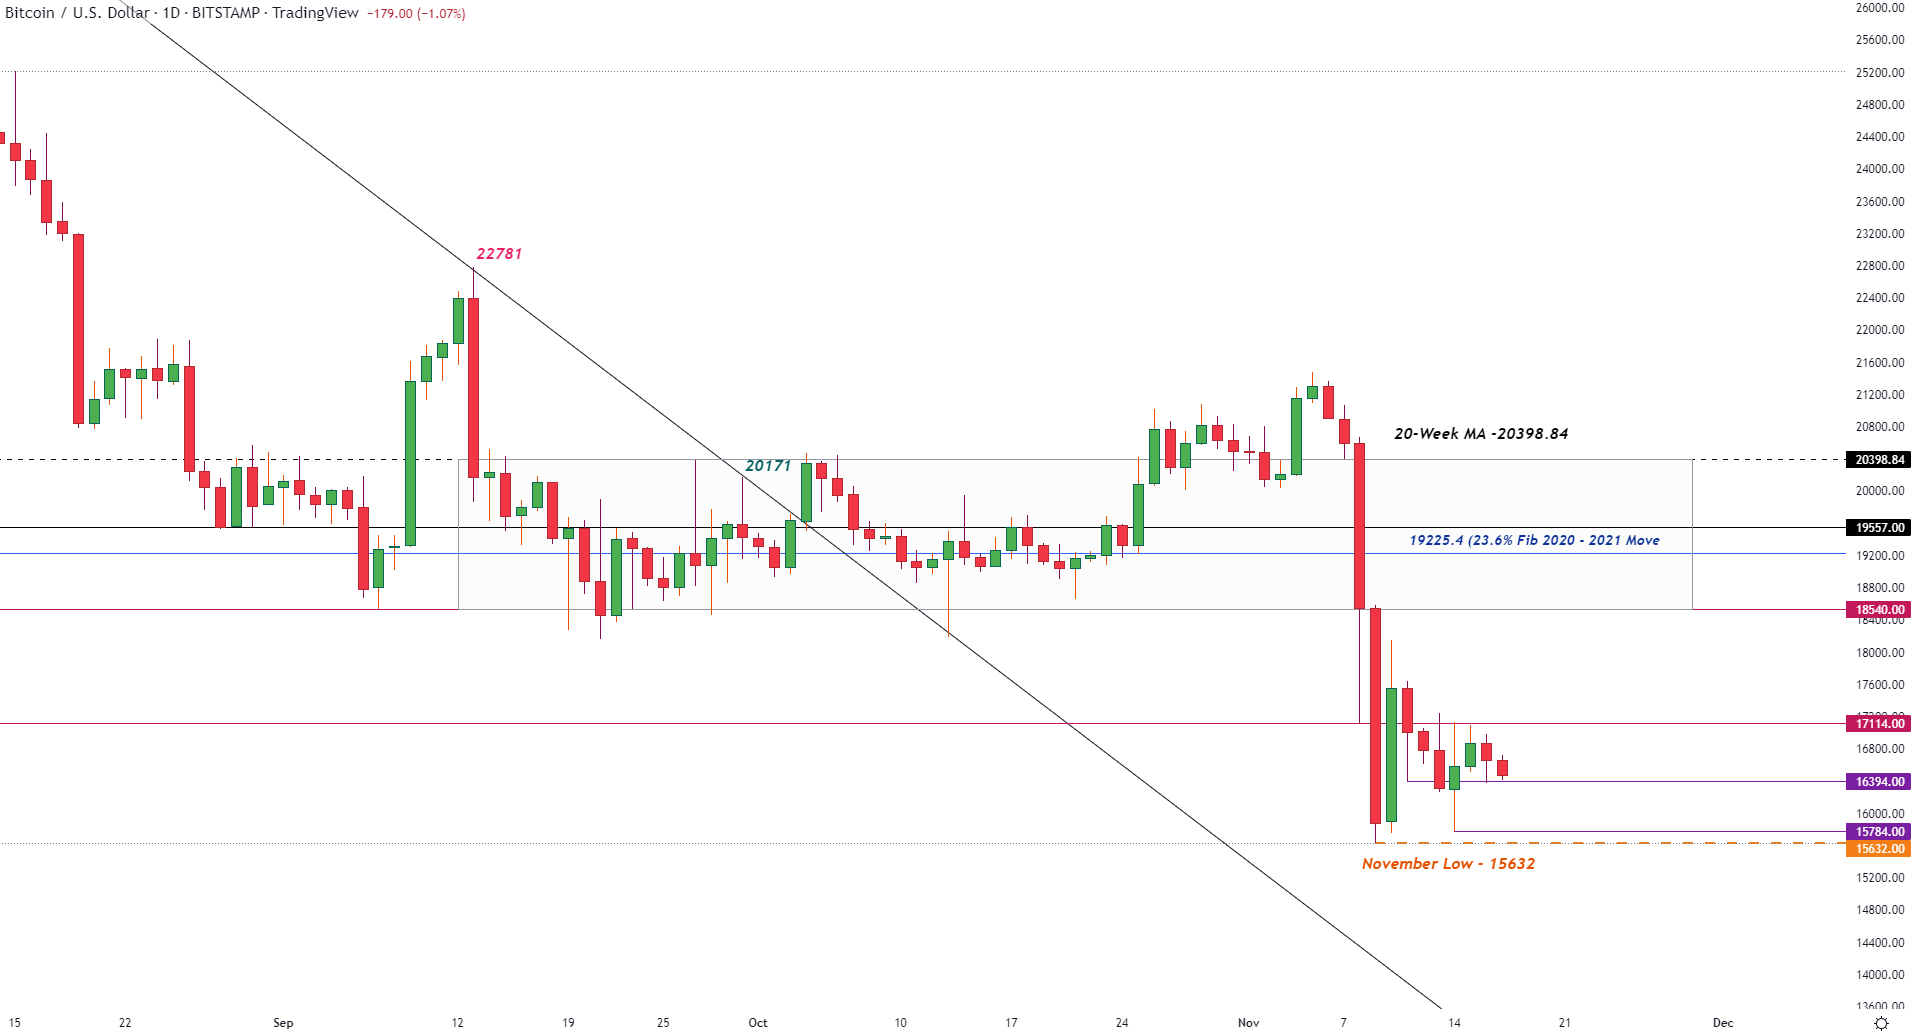
Chart prepared by Tammy Da Costa using TradingView
Ethereum (ETH/USD) Technical Analysis
Ethereum is currently down roughly 1.5% (at the time of writing) as prices briefly did below $1200. As the 23.6% Fibonacci of the 2020 – 2021 move comes in as resistance at $1216.42, the October low holds as support at $1155. While price action hovers around the $1200 psych level, a retest of the daily low at $1182.2 could provide bears with more fuel to drive the second largest digital asset lower.
Ethereum (ETH/USD) Daily Chart
(Click on image to enlarge)
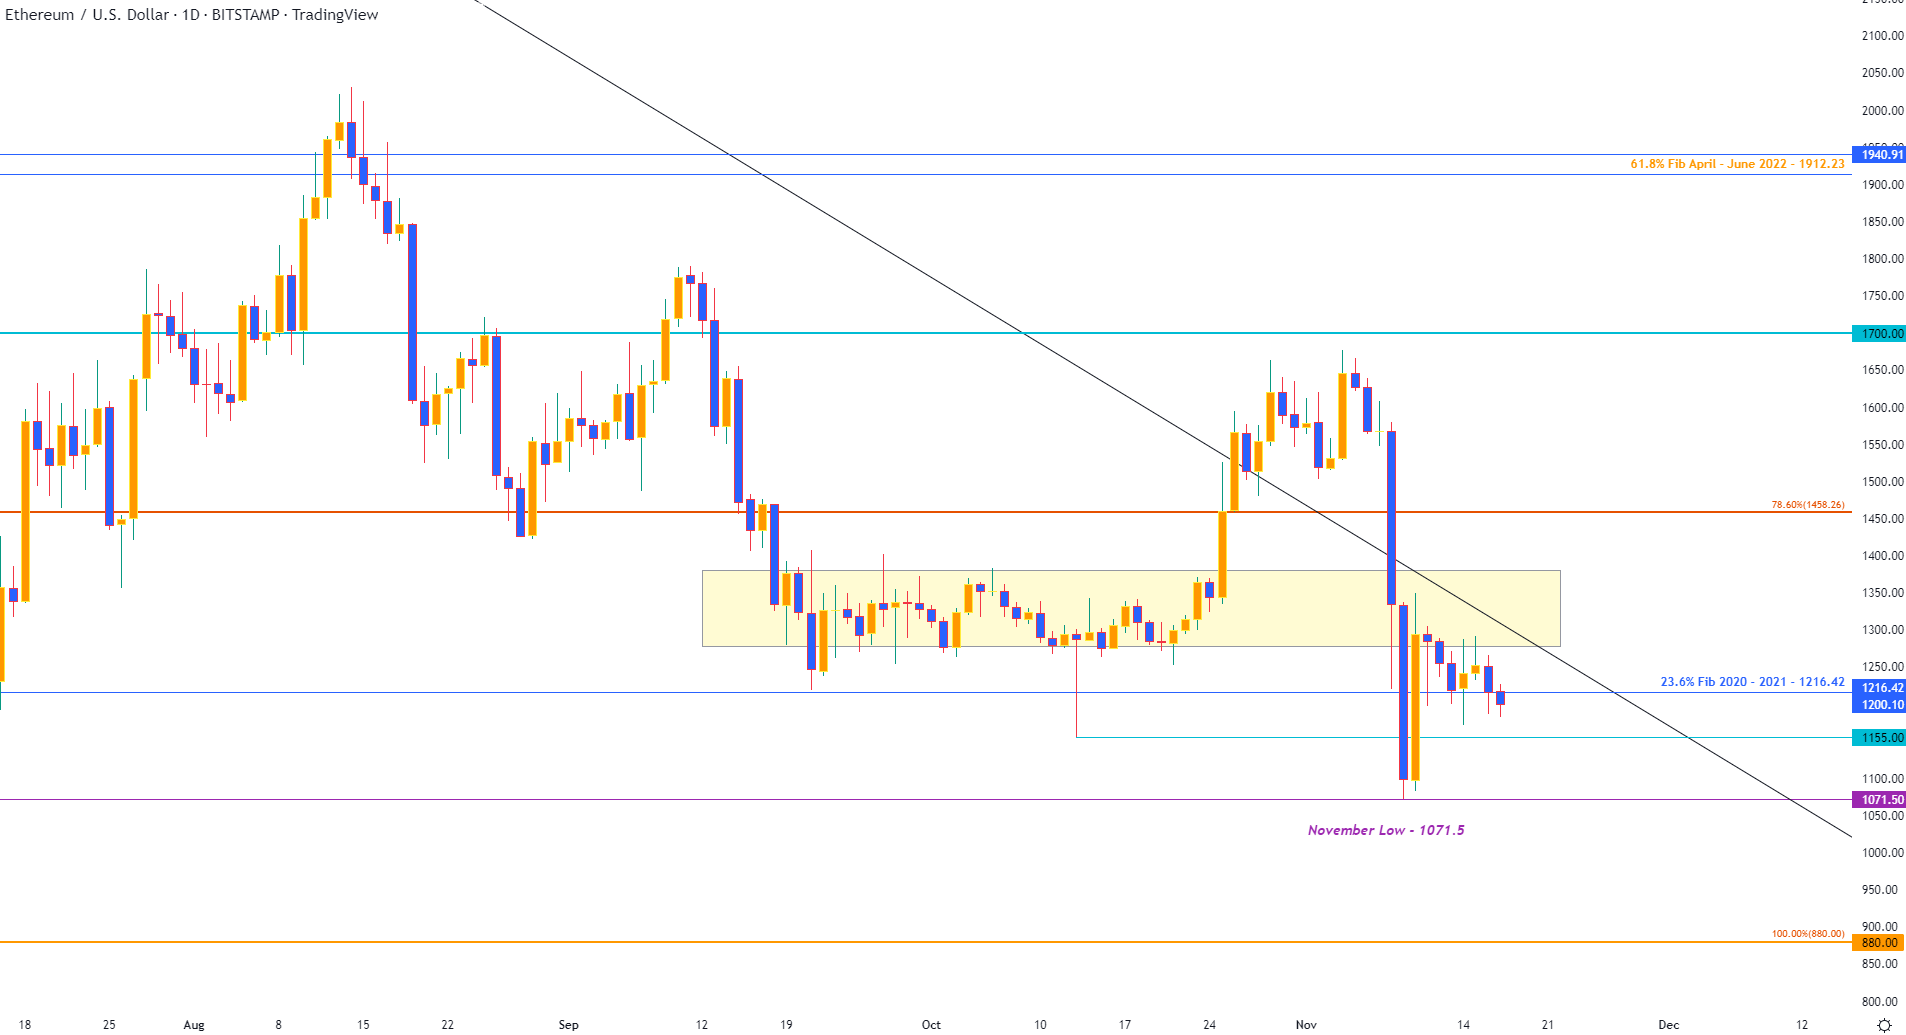
Chart prepared by Tammy Da Costa using TradingView
Litecoin (LTC/USD) Technical Analysis
While its major crypto counterparts struggle to gain traction, Litecoin is trading 5% higher on the day as prices retest $60. A move higher could see prices rise to the 10 November high of $61.08 with a break above bringing the next zone of resistance into play at the November 11 high of $64.13.
Litecoin (LTC/USD) Daily Chart
(Click on image to enlarge)
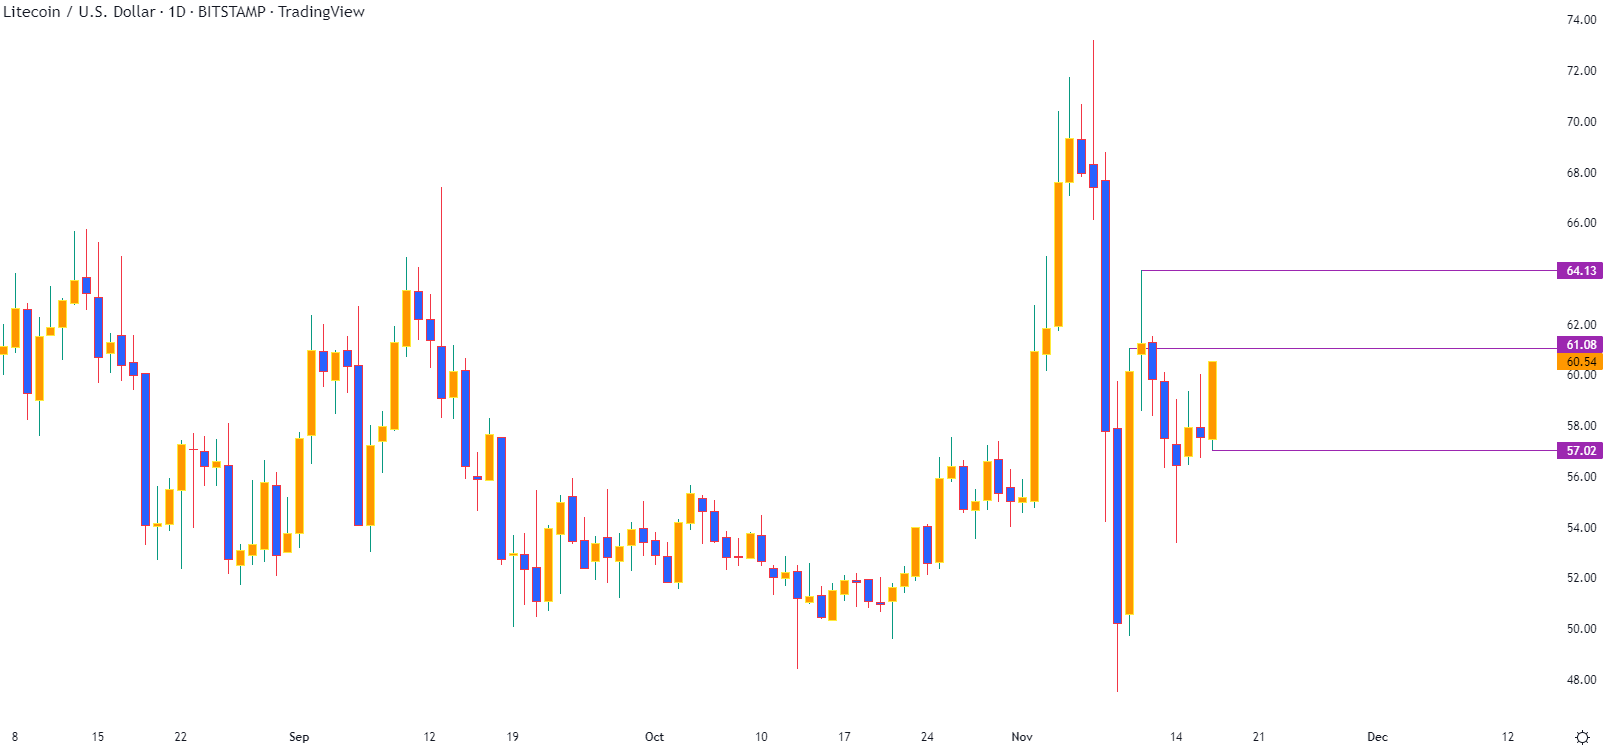
Chart prepared by Tammy Da Costa using TradingView
More By This Author:
Dax, FTSE Step Back After UK Inflation Hits Highest Level Since 1981
Bitcoin (BTC), Ethereum (ETH) Upbeat Despite FTX Saga As PPI Falls
Dax (German 40) Enters Bull Market Territory – Infineon Leads Gains


