
Comex Update: The Gold Shorts Are Delaying Delivery

Gold: Recent Delivery Month
November gold is showing strength even if it is still short of the massive delivery volume in September (the last minor month). At 6,620 contracts delivered so far, it is showing relative strength compared to almost any month last year. Furthermore, with 1,824 contracts remaining in Open Interest, there is still more delivery to go.
(Click on images to enlarge)
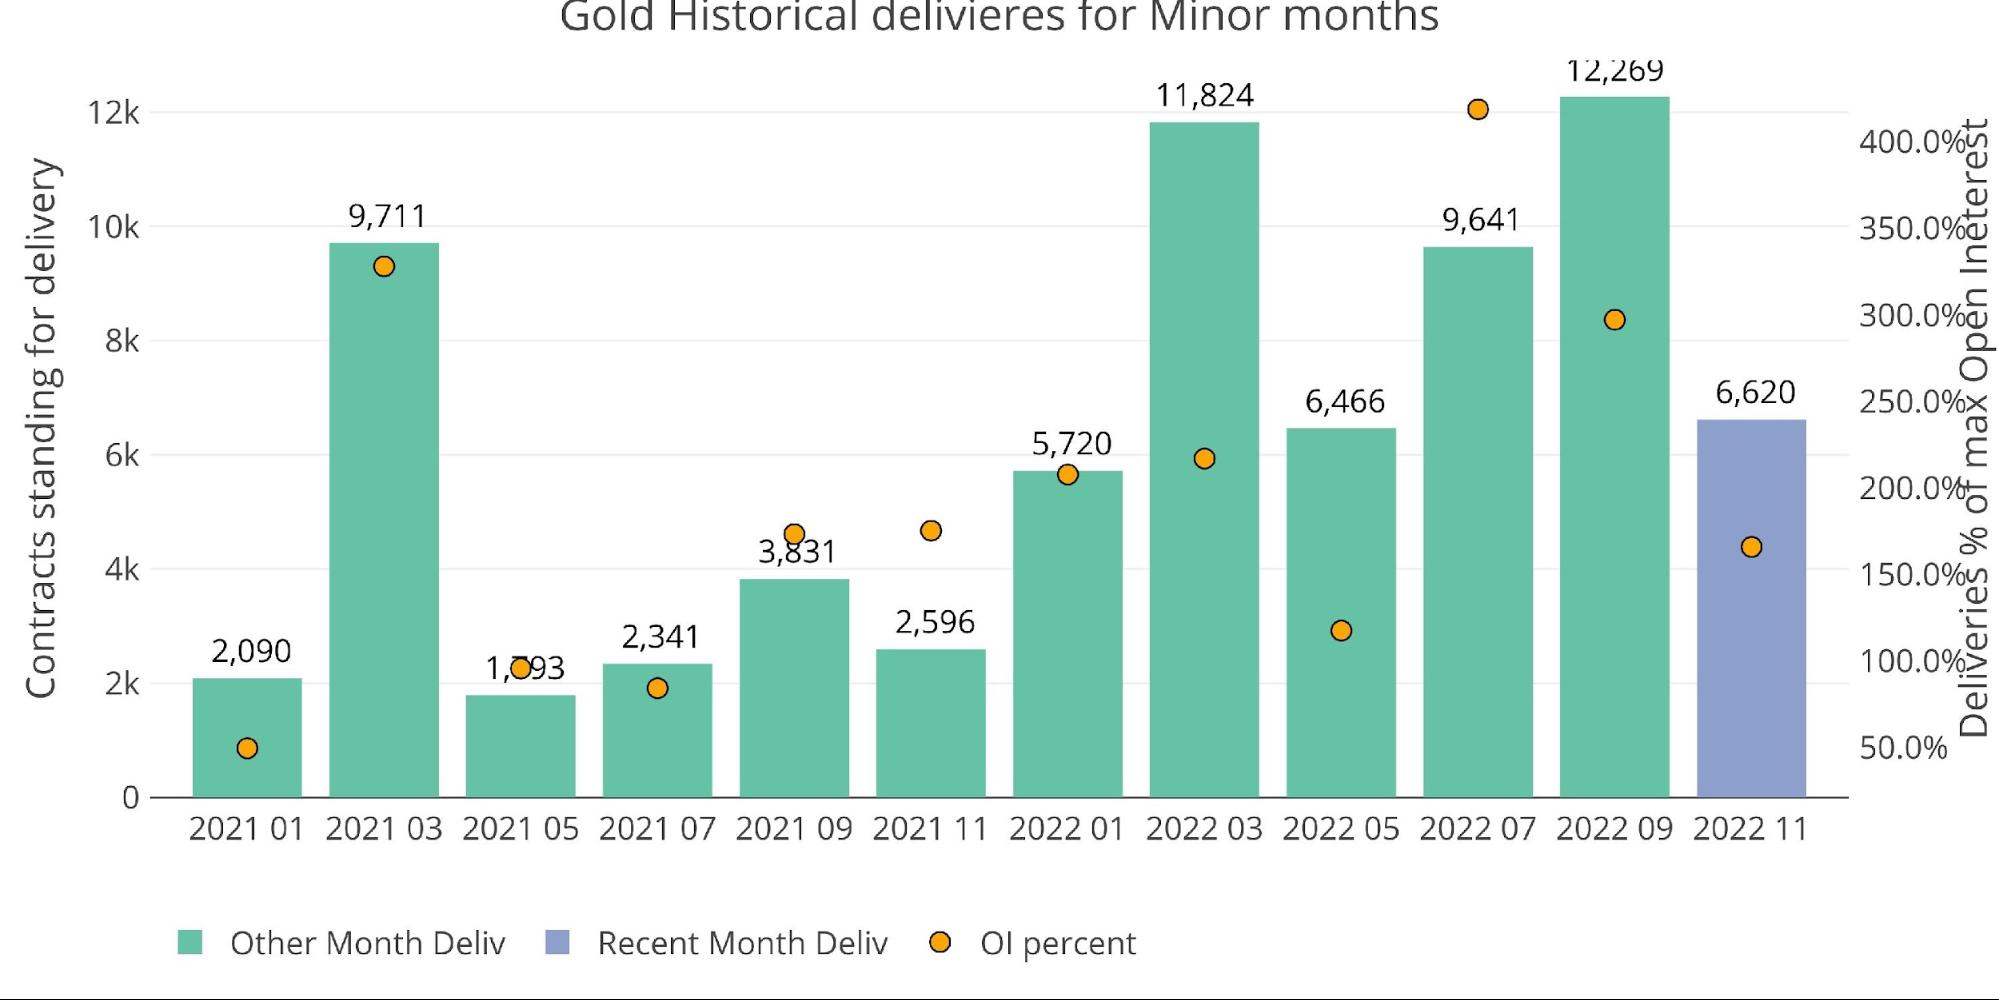
Figure: 1 Recent like-month delivery volume
One major reason for the delivery volume being lower than in recent months is that net new contracts (NNC) standing for immediate delivery has been very flat since 4 days after First Notice (see red line below). After starting very strong with 2,476 NNC in 4 days, the NNC total has only reached 4,462. This means that less than 2k NNC have been added in the last 13 business days.

Figure: 2 Cumulative Net New Contracts
Even with the smaller NNC, delivery volume is still relatively high because of the large number of contracts open on First Notice (green bar below). On First Notice there were 3,962 contracts open. For comparison, last November only had 500 contracts open on First Notice!
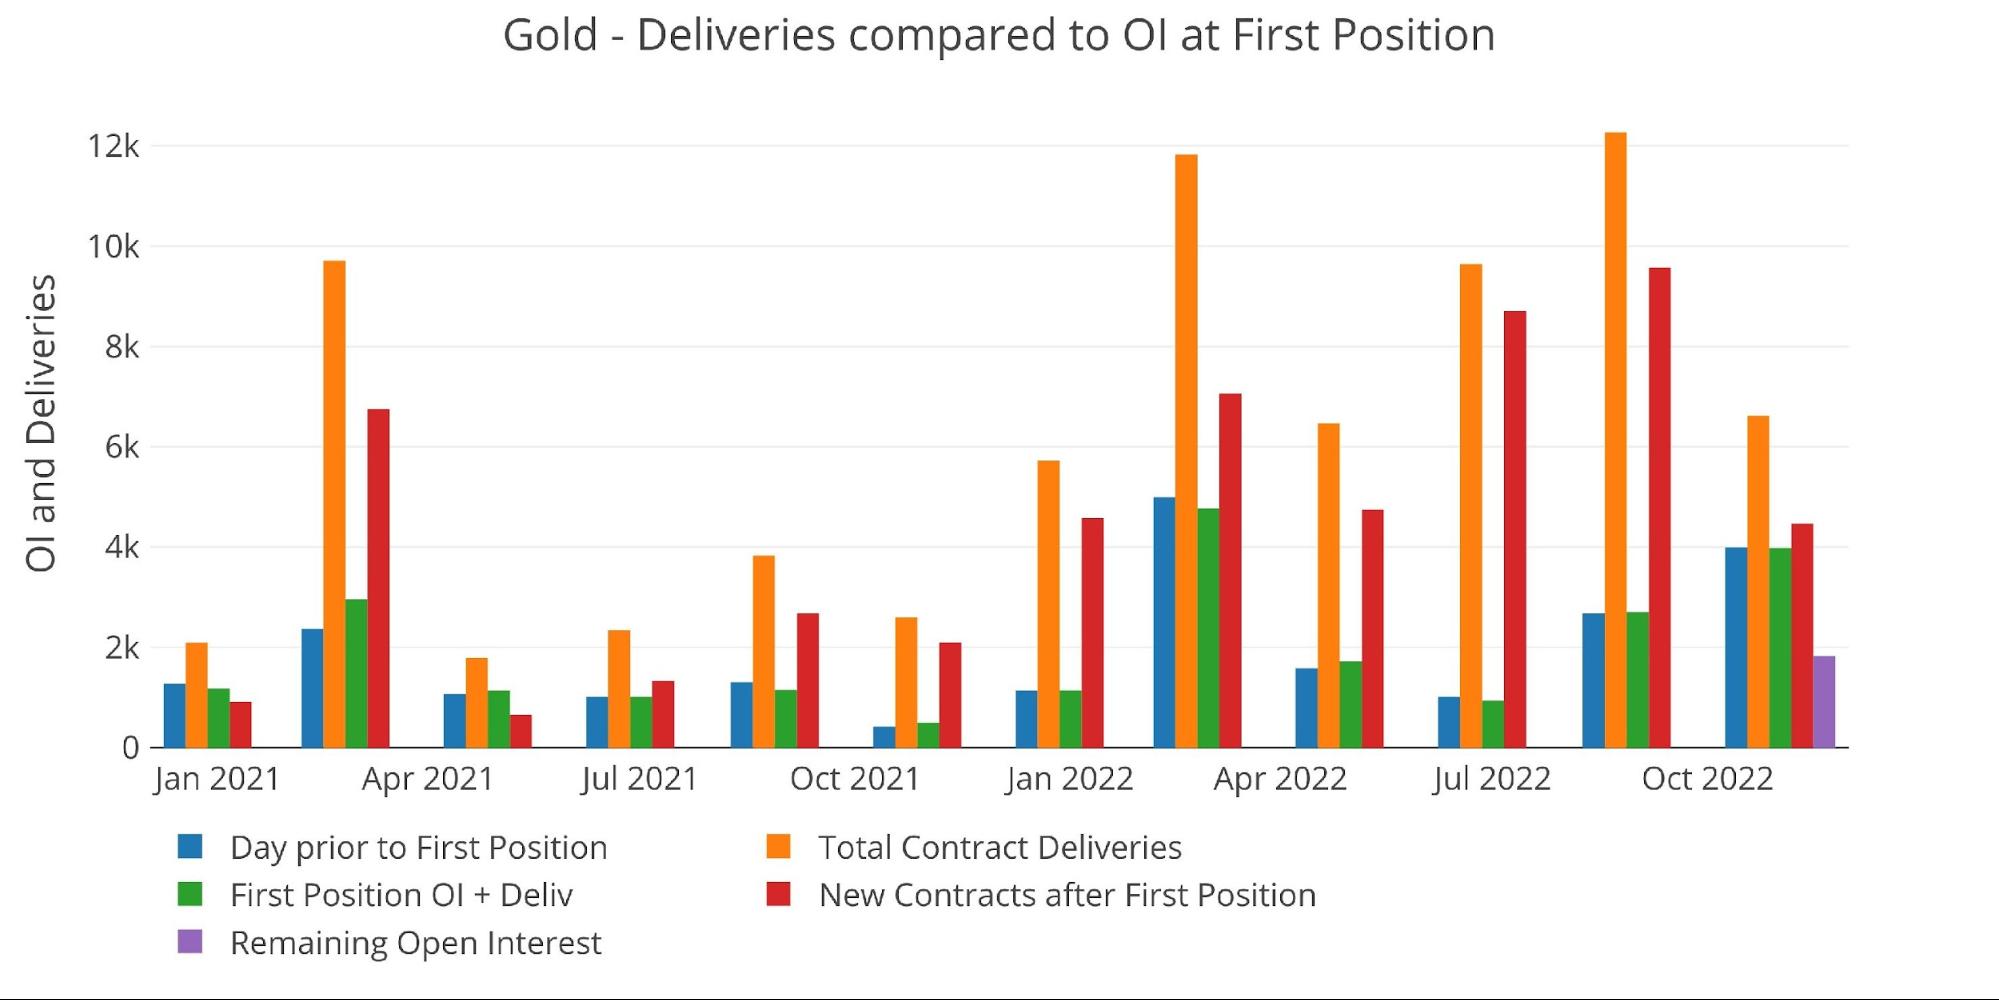
Figure: 3 24-month delivery and first notice
One other thing to notice in the plot above is the relatively high open interest remaining (purple bar) at this late stage in the contract (17 days after First Notice). With 1,833 contracts still open, this is the third-highest open interest on day 17. Only April and February 2021 were higher which was right around the time of the Reddit silver squeeze.
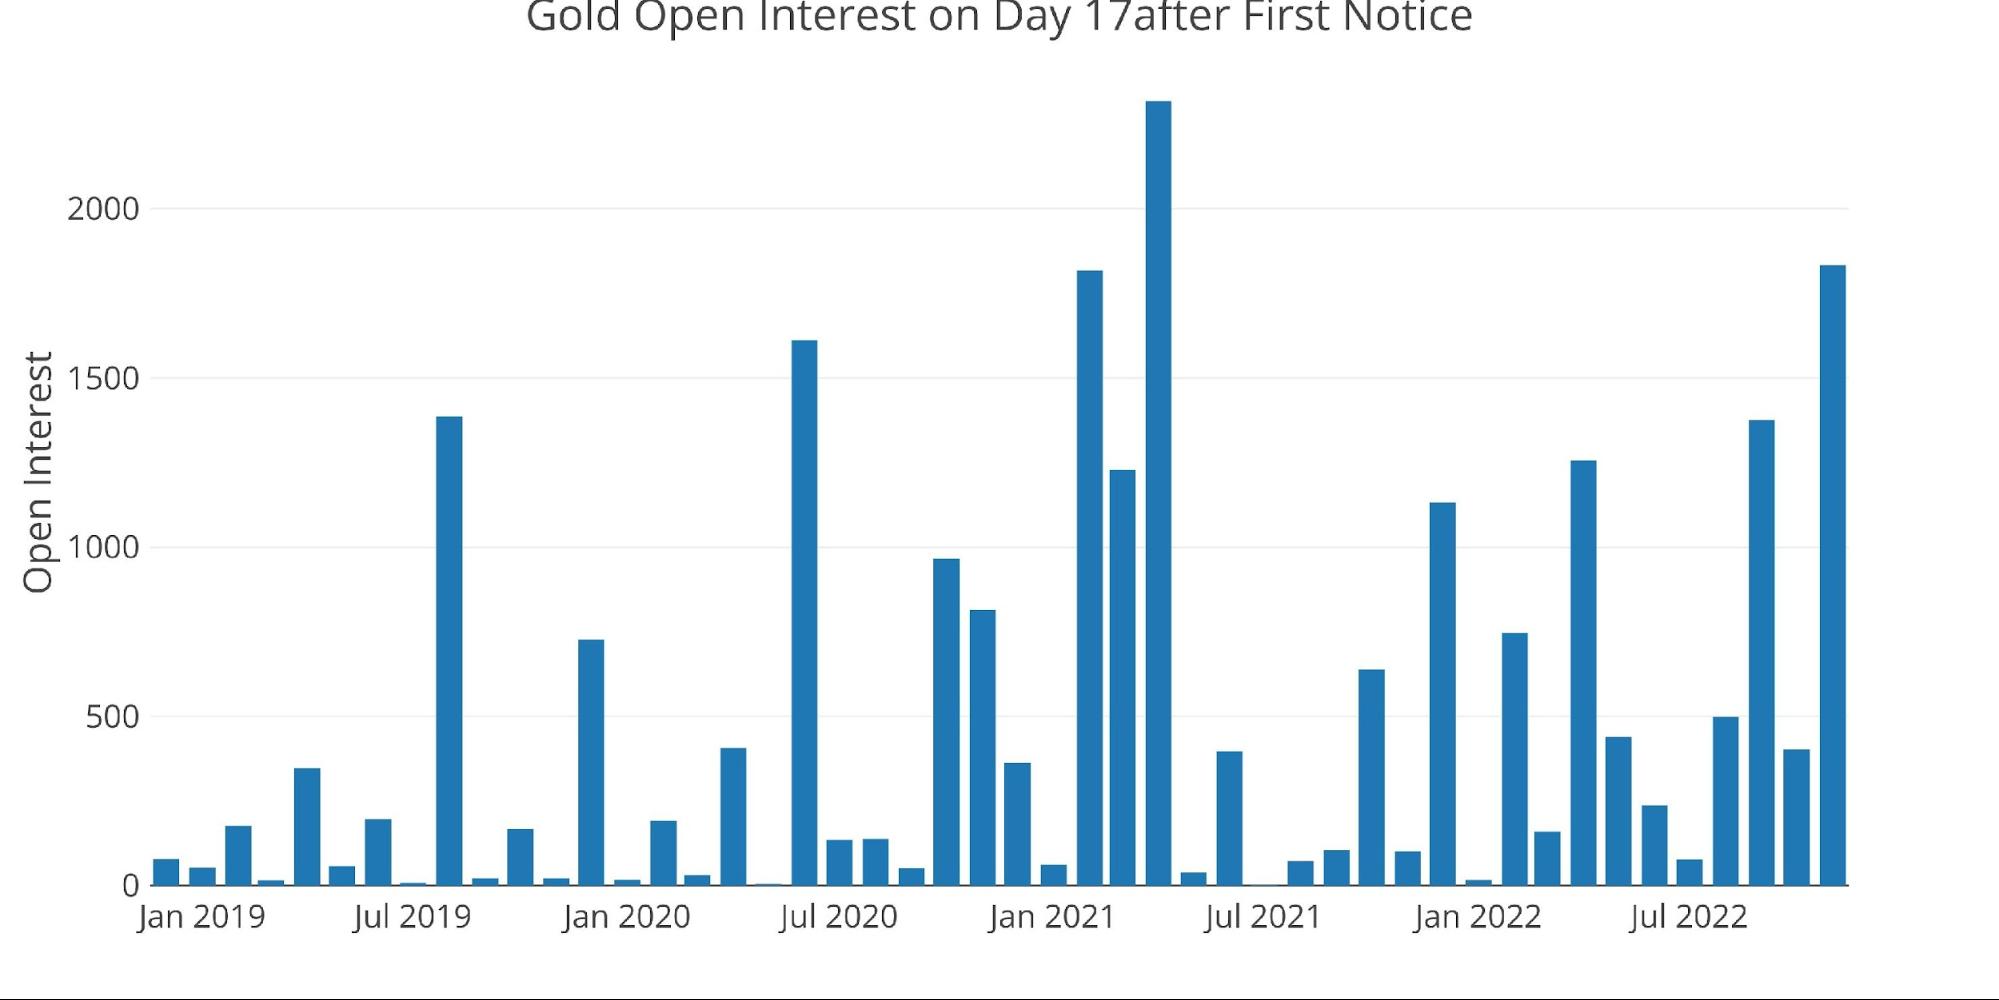
Figure: 4 Delivery Volume After First Notice
The biggest difference between April and Feb 2021, is that these are major contract months when open interest is higher in general. When looking at open interest as a percentage of open interest on First Notice, the current month is at 46%. This is behind only September of this year and November 2020. Both of these set minor month delivery records.
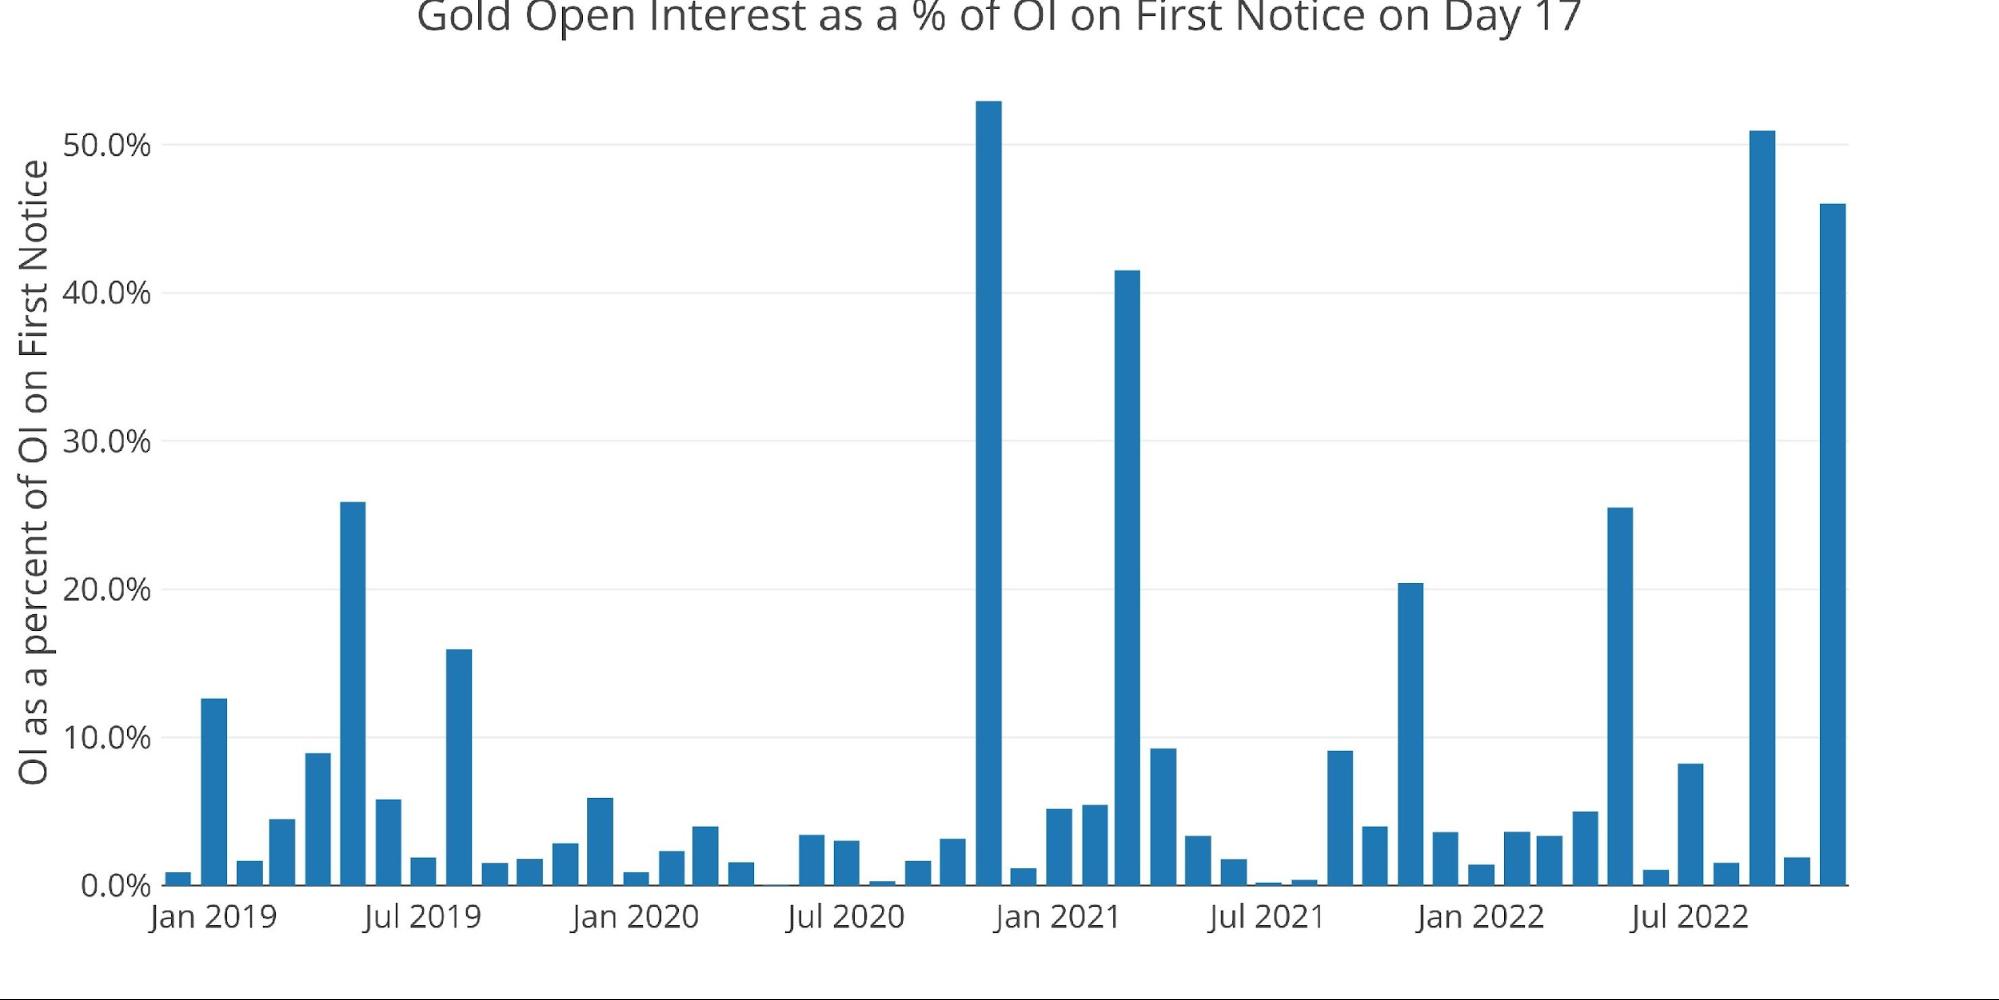
Figure: 5 Delivery Volume After First Notice
So, what’s going on? Why does so much open interest remain to be delivered? That is a question for the shorts. When a long decides to stand for delivery, the short gets to pick when they deliver as long as it happens before the contract expires, which is typically about a month after First Notice.
So why haven’t the shorts delivered out the metal? Is it because supply is tighter than it seems? If we look at the bank house account activity below, you can see that this November has seen the smallest activity (long or short) in a year. Why have the house accounts gone so quiet all of a sudden?
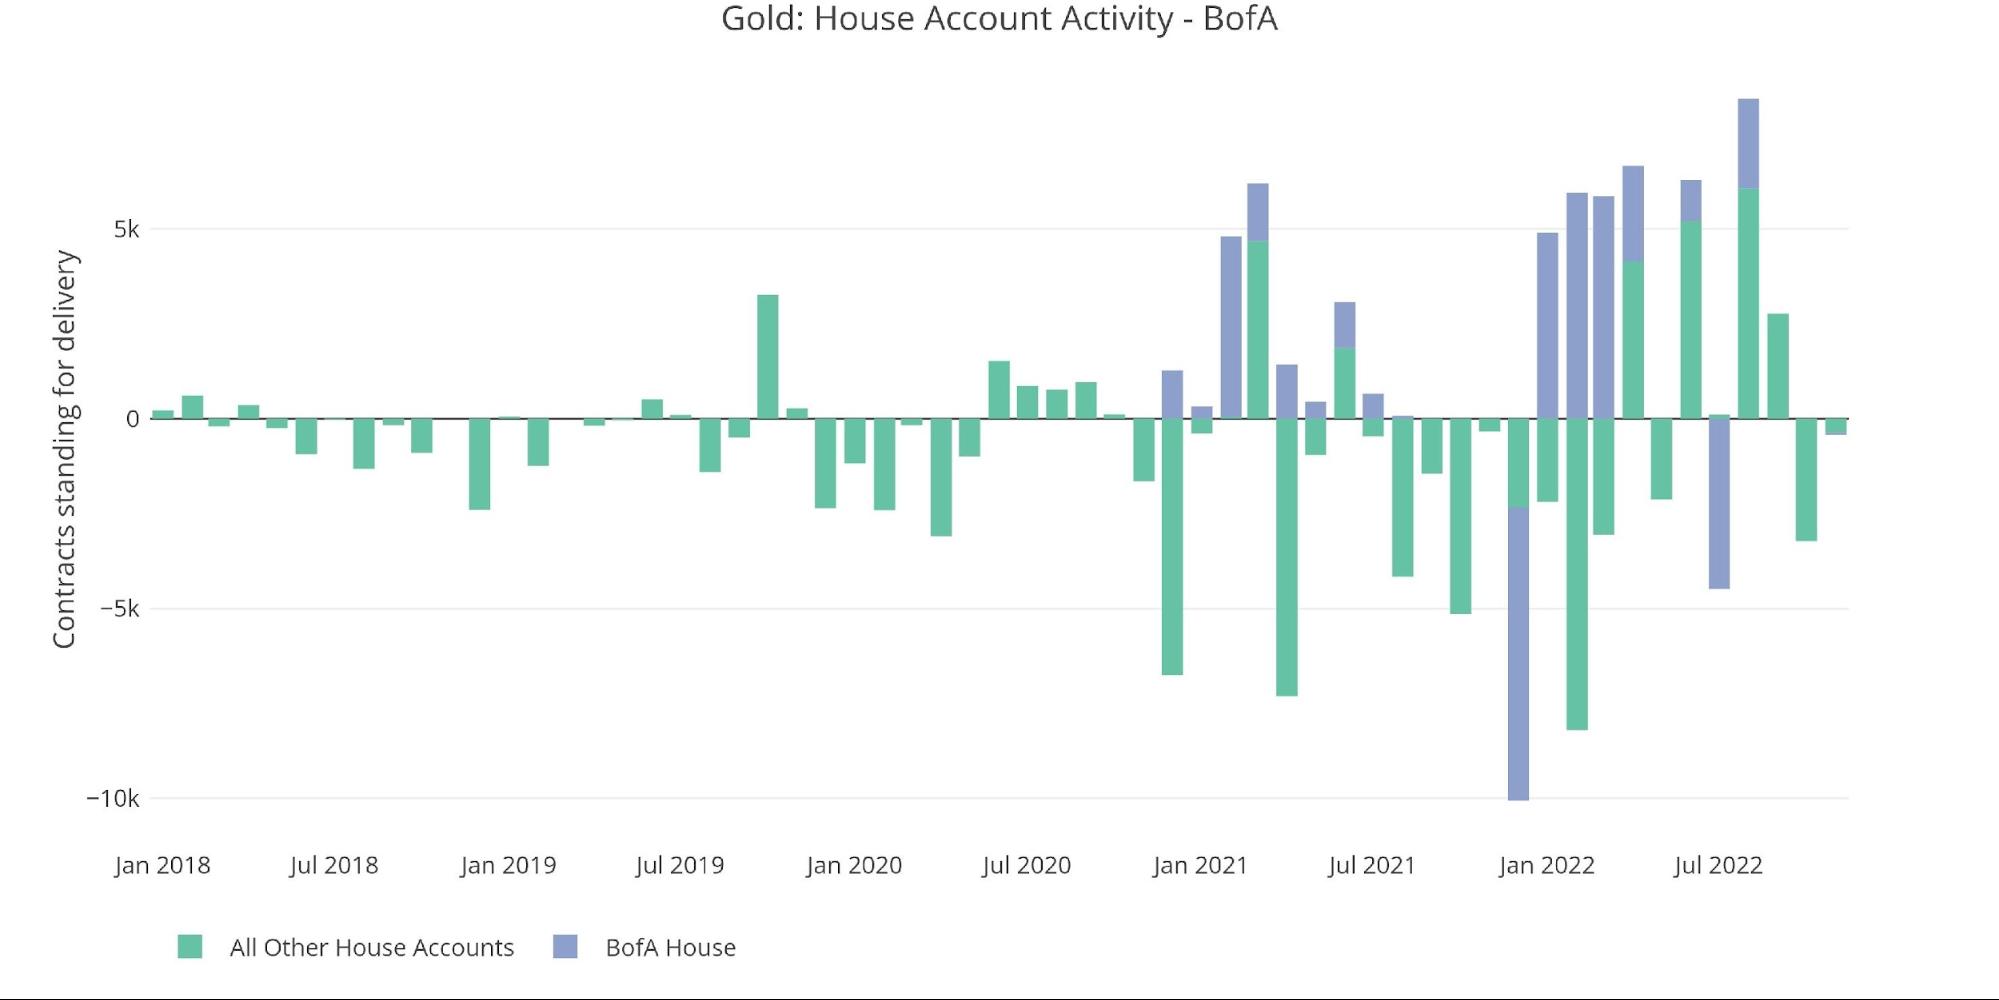
Figure: 6 House Account Activity
One possibility, as shown in the recent stock report is that supplies of physical metal have been heavily depleted. The chart below shows this activity, as metal consistently leaves the Comex system day after day.
The Comex inventory report shows plenty of Registered gold left (unlike silver), but how much of this metal is truly available to meet delivery requests? The activity explained above could lead someone to conclude that physical supplies are much lower than indicated.
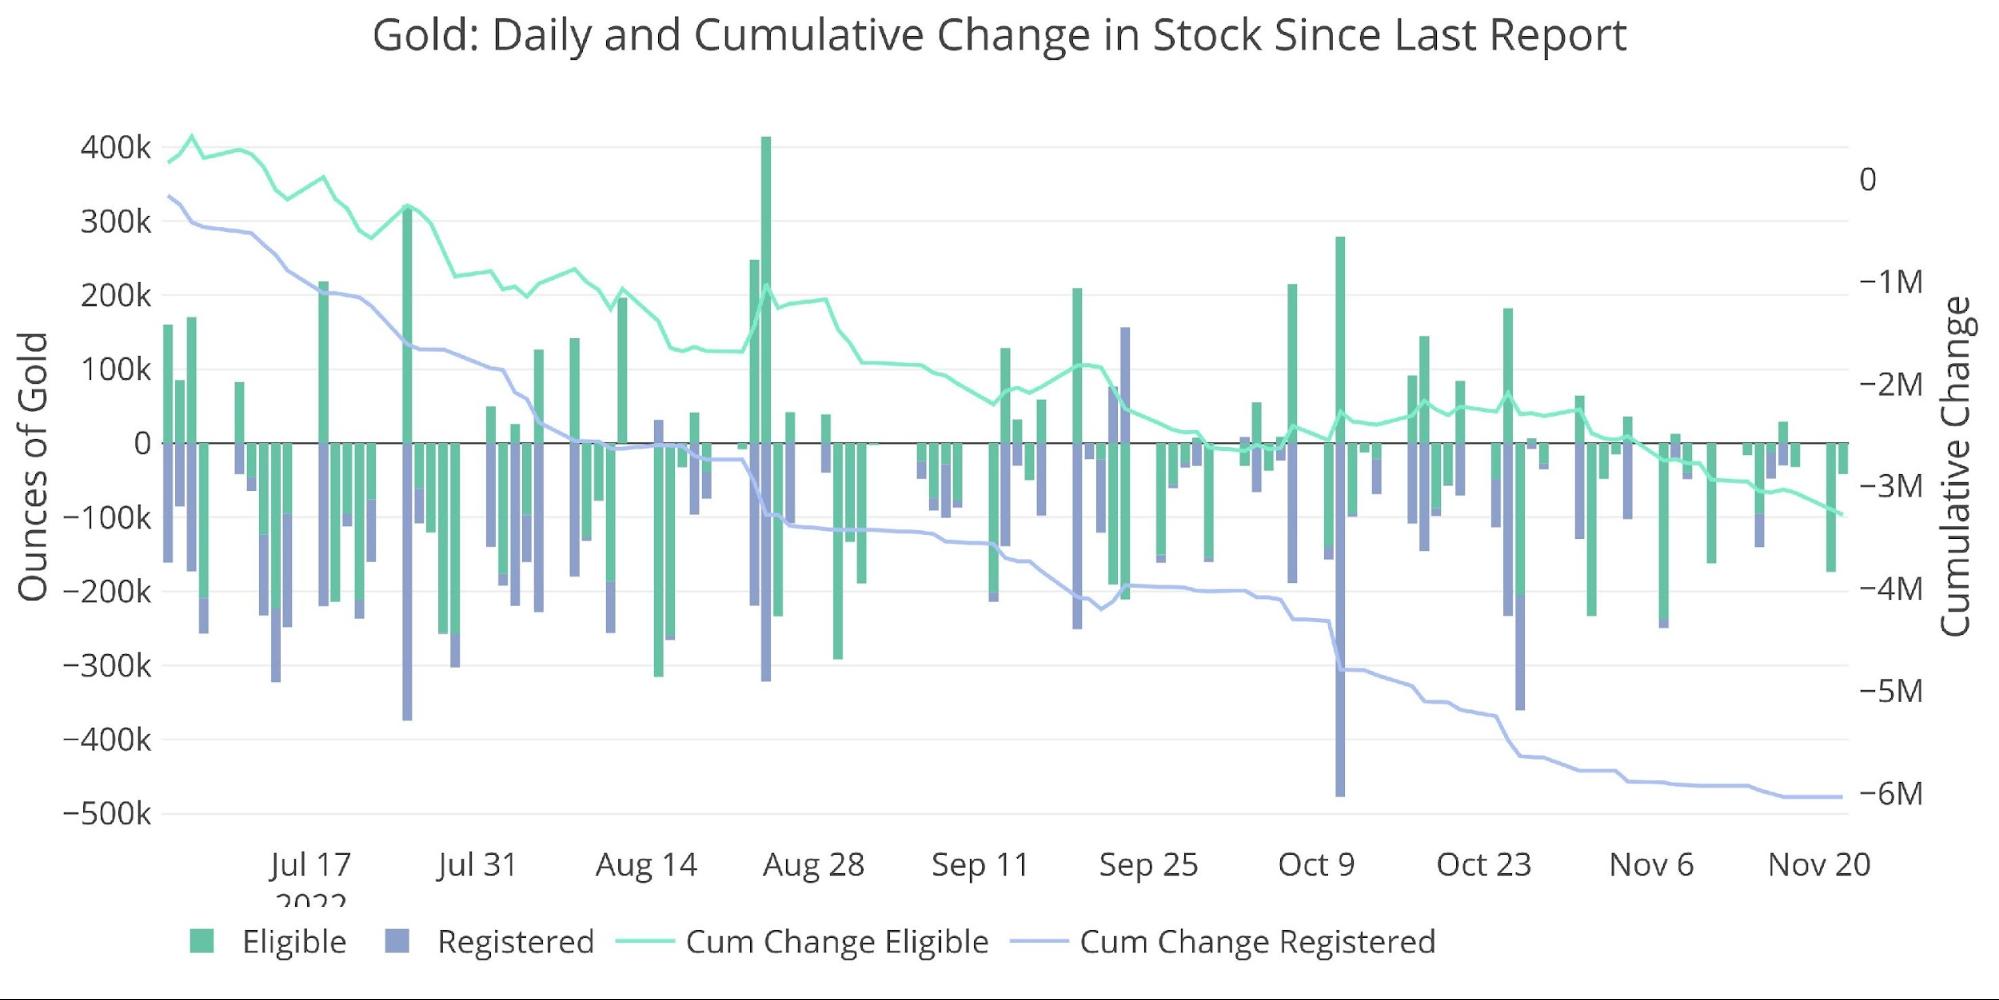
Figure: 7 Recent Monthly Stock Change
Gold: Next Delivery Month
Jumping ahead to December shows we could see some major fireworks. The countdown chart below shows that we are currently below trend for this stage in the contract.
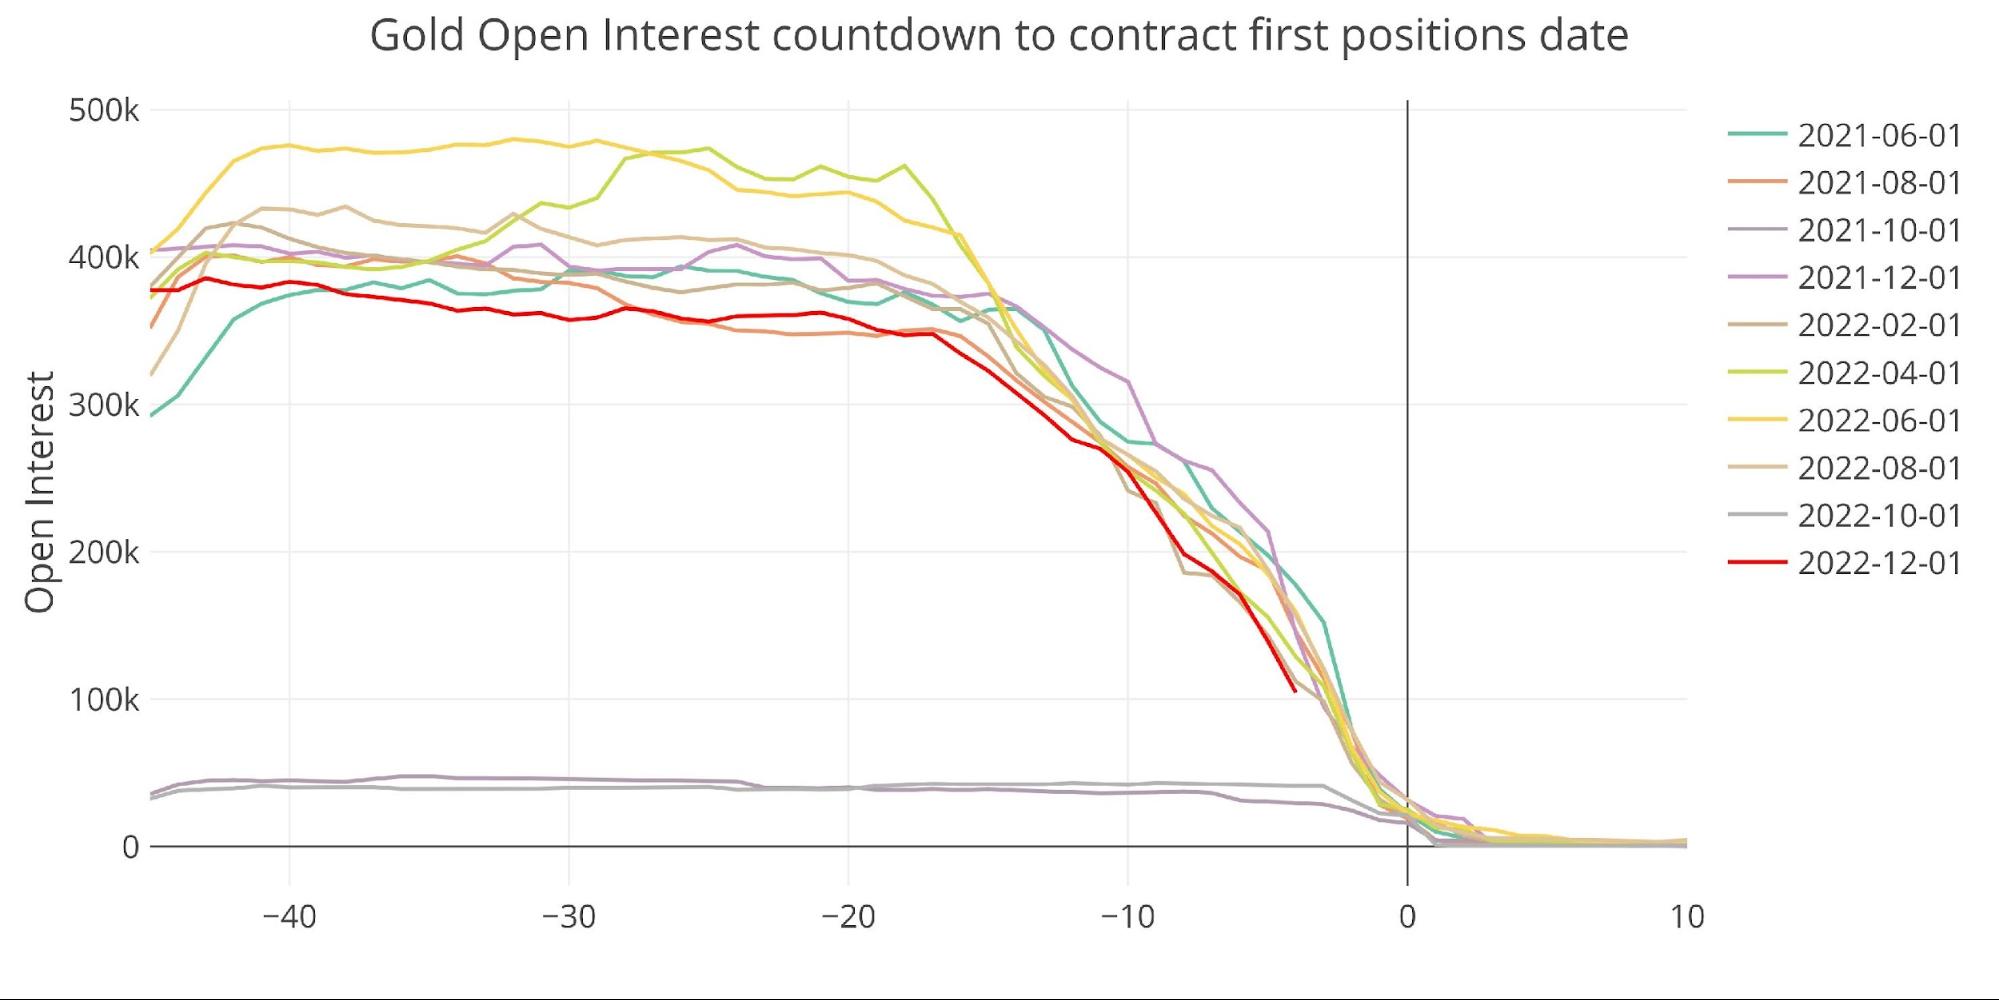
Figure: 8 Open Interest Countdown
That said, if we plot the same data as a percentage of Registered available, then this month actually looks like one of the strongest months seen recently.
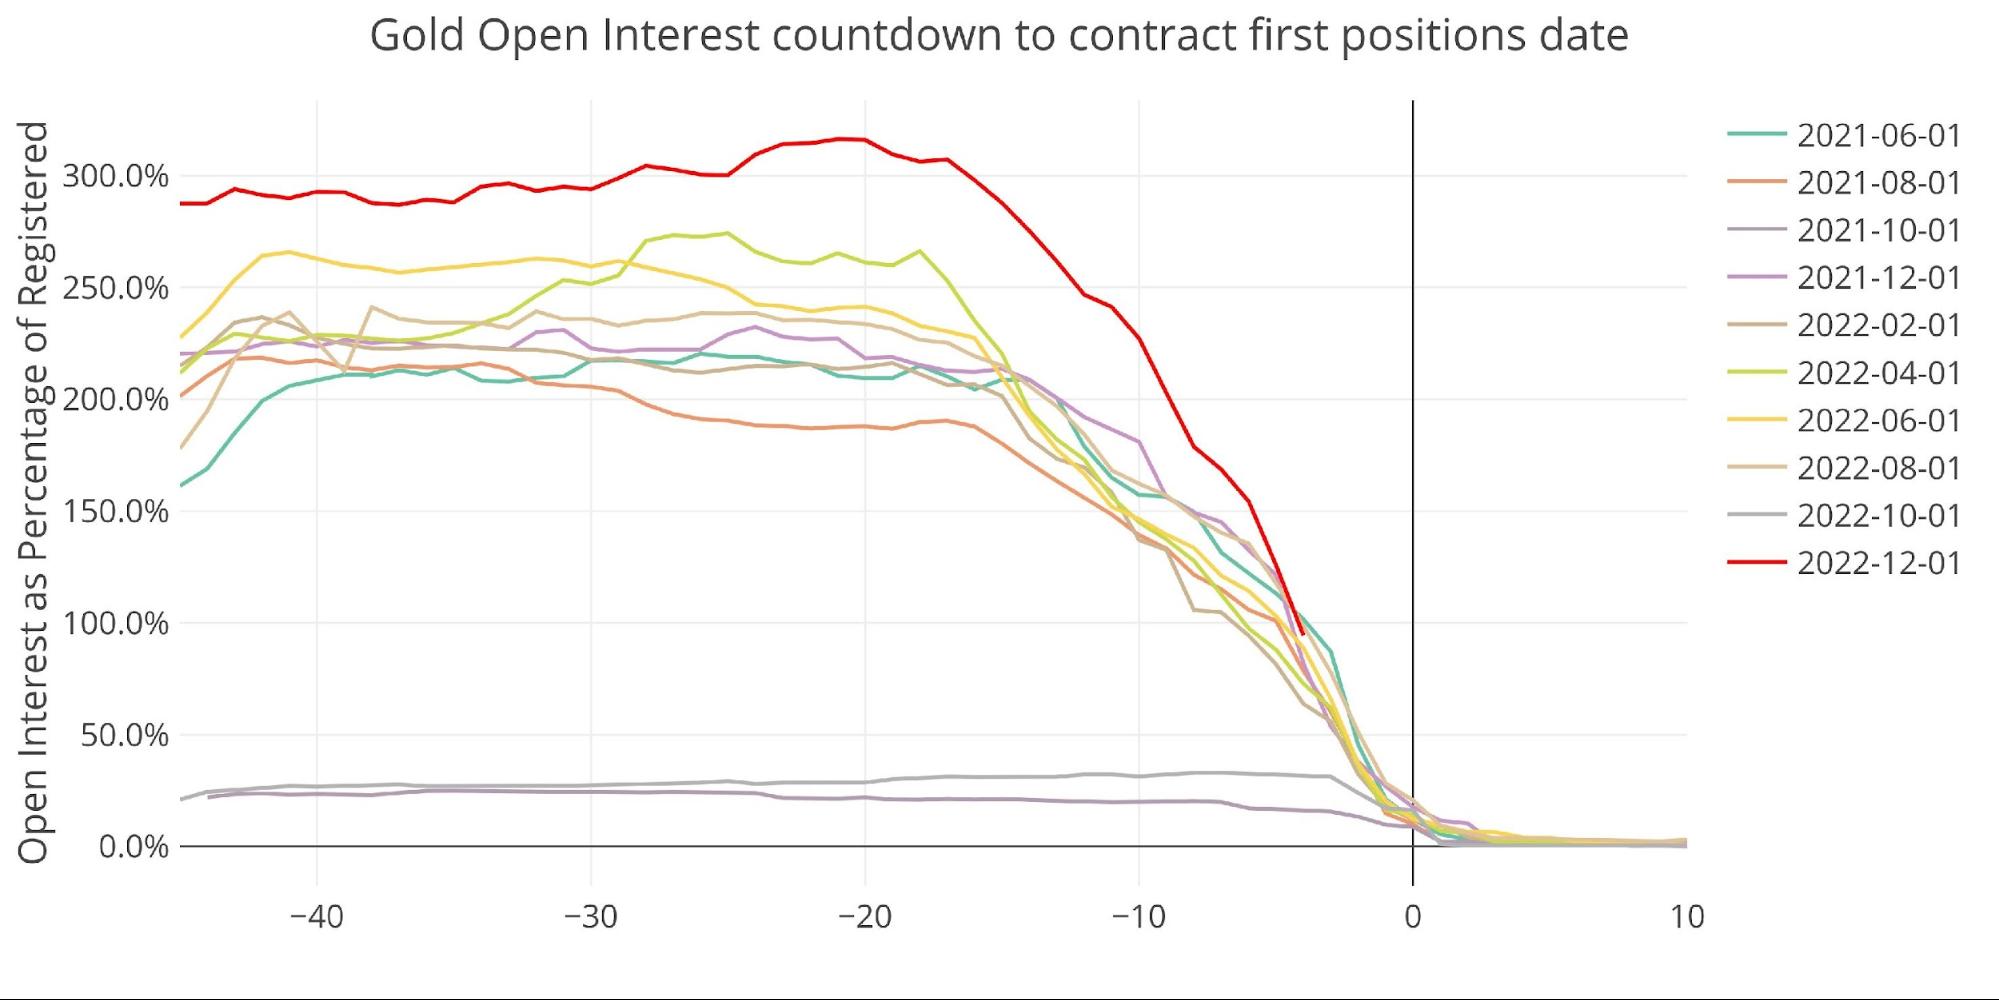
Figure: 9 Countdown Percent
Last December saw over 36k contracts delivered. While there is technically enough Registered supply to meet a similar demand for delivery requests, it could be assumed that the shorts might scramble to come up with the metal the way they are this month.
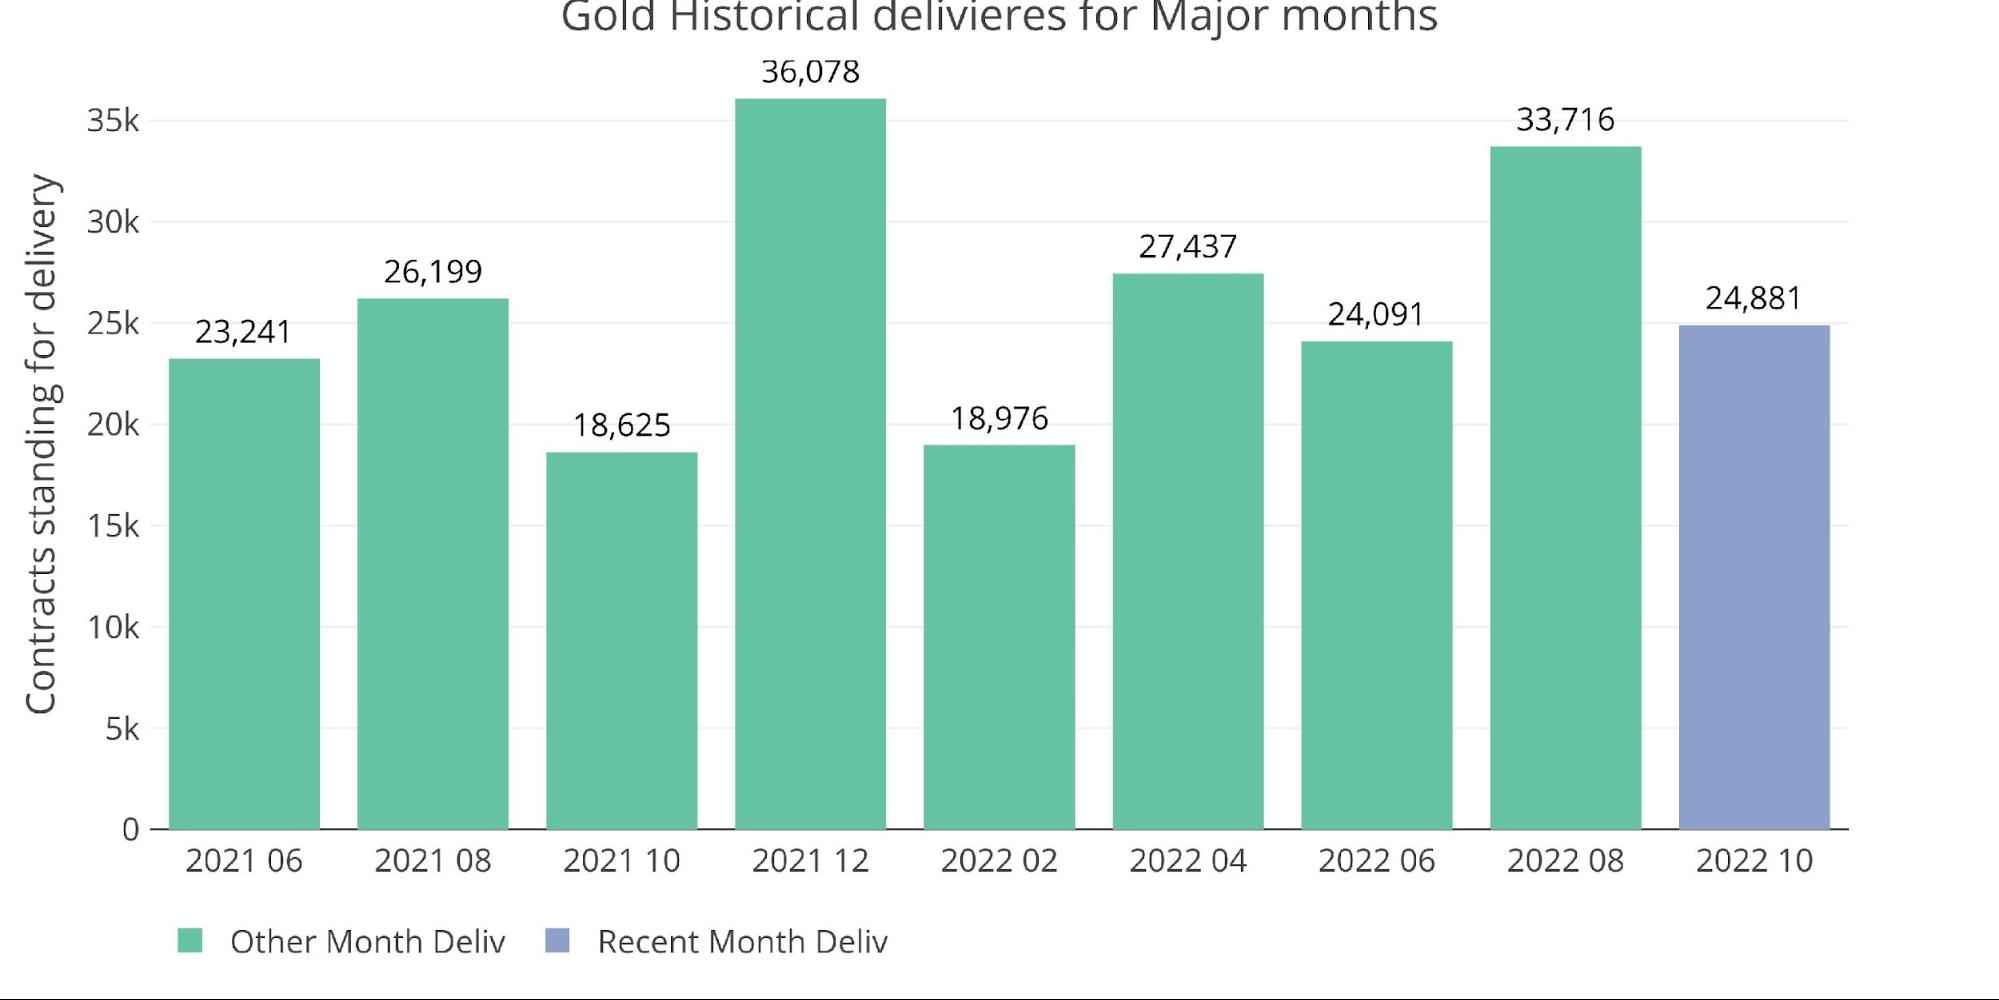
Figure: 10 Historical Deliveries
Spreads
Looking at spreads, the futures market remains in strong contango.
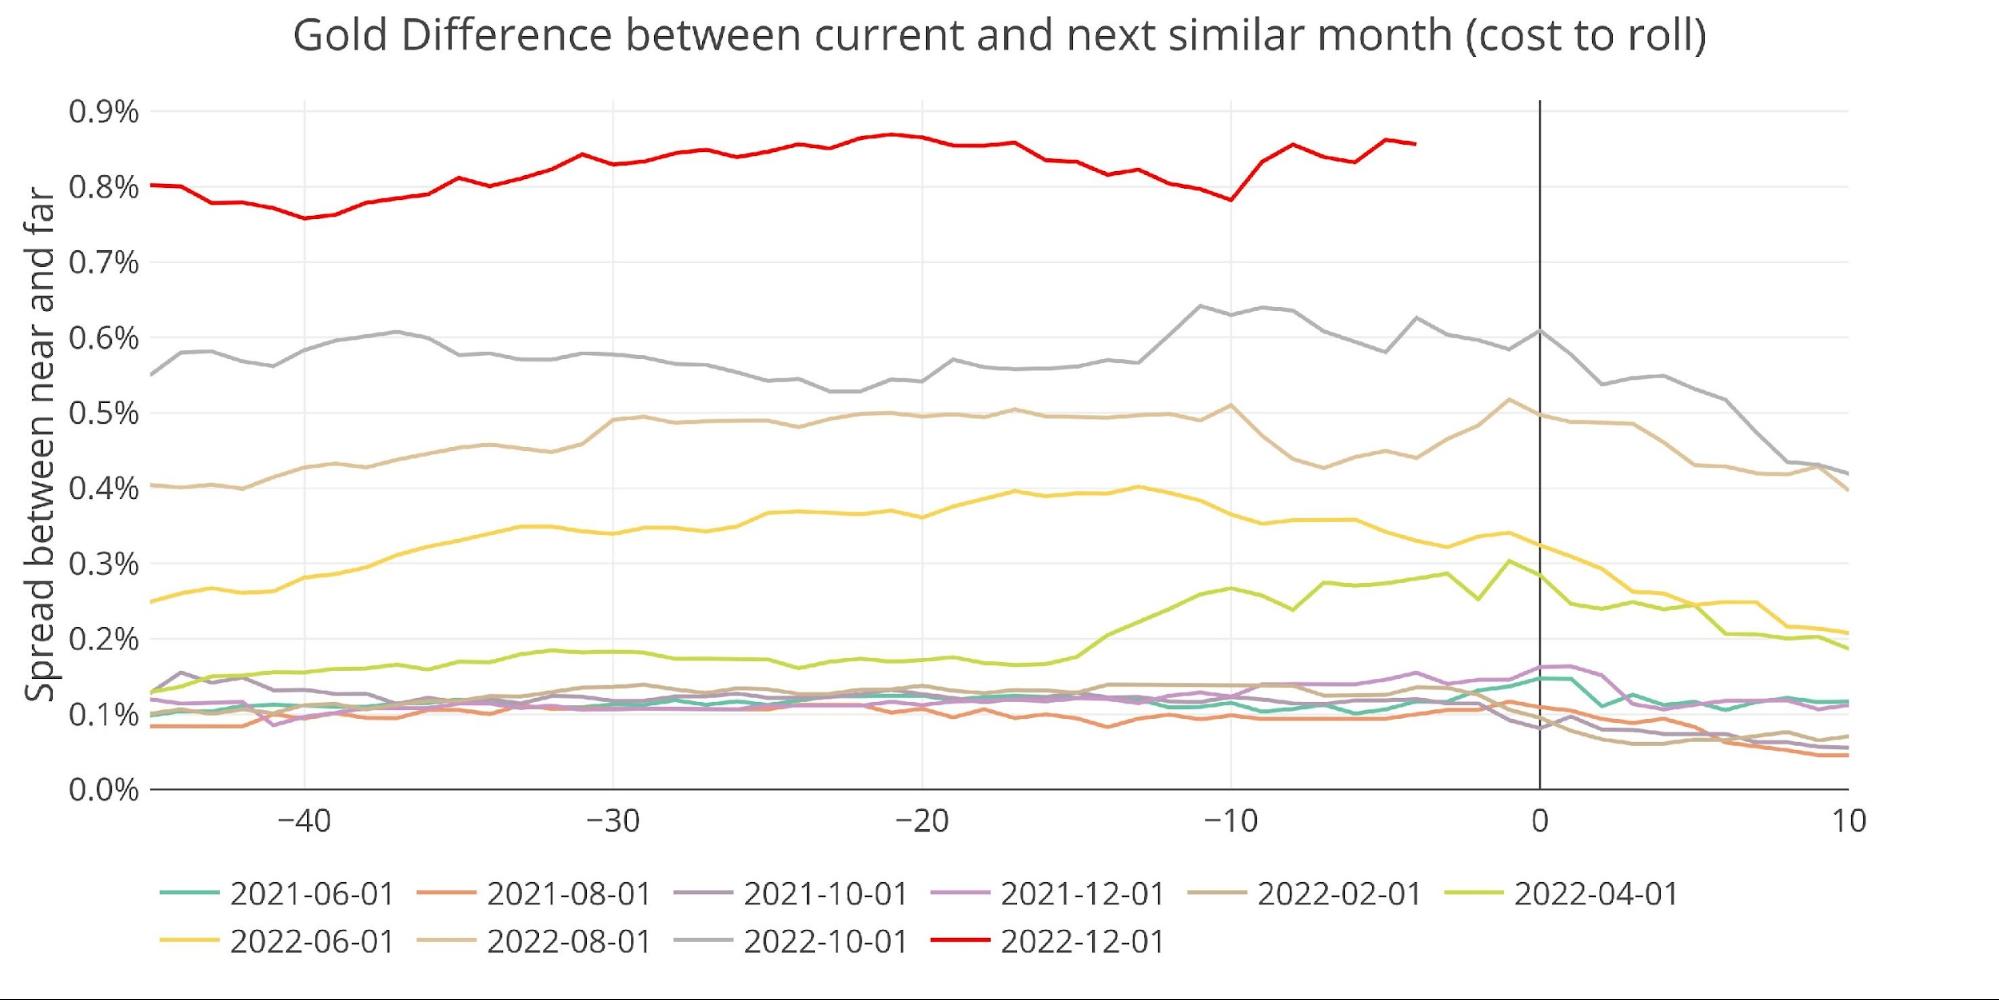
Figure: 11 Futures Spreads
The spot market is also seeing a modest contango after dealing with a few periods of backwardation.
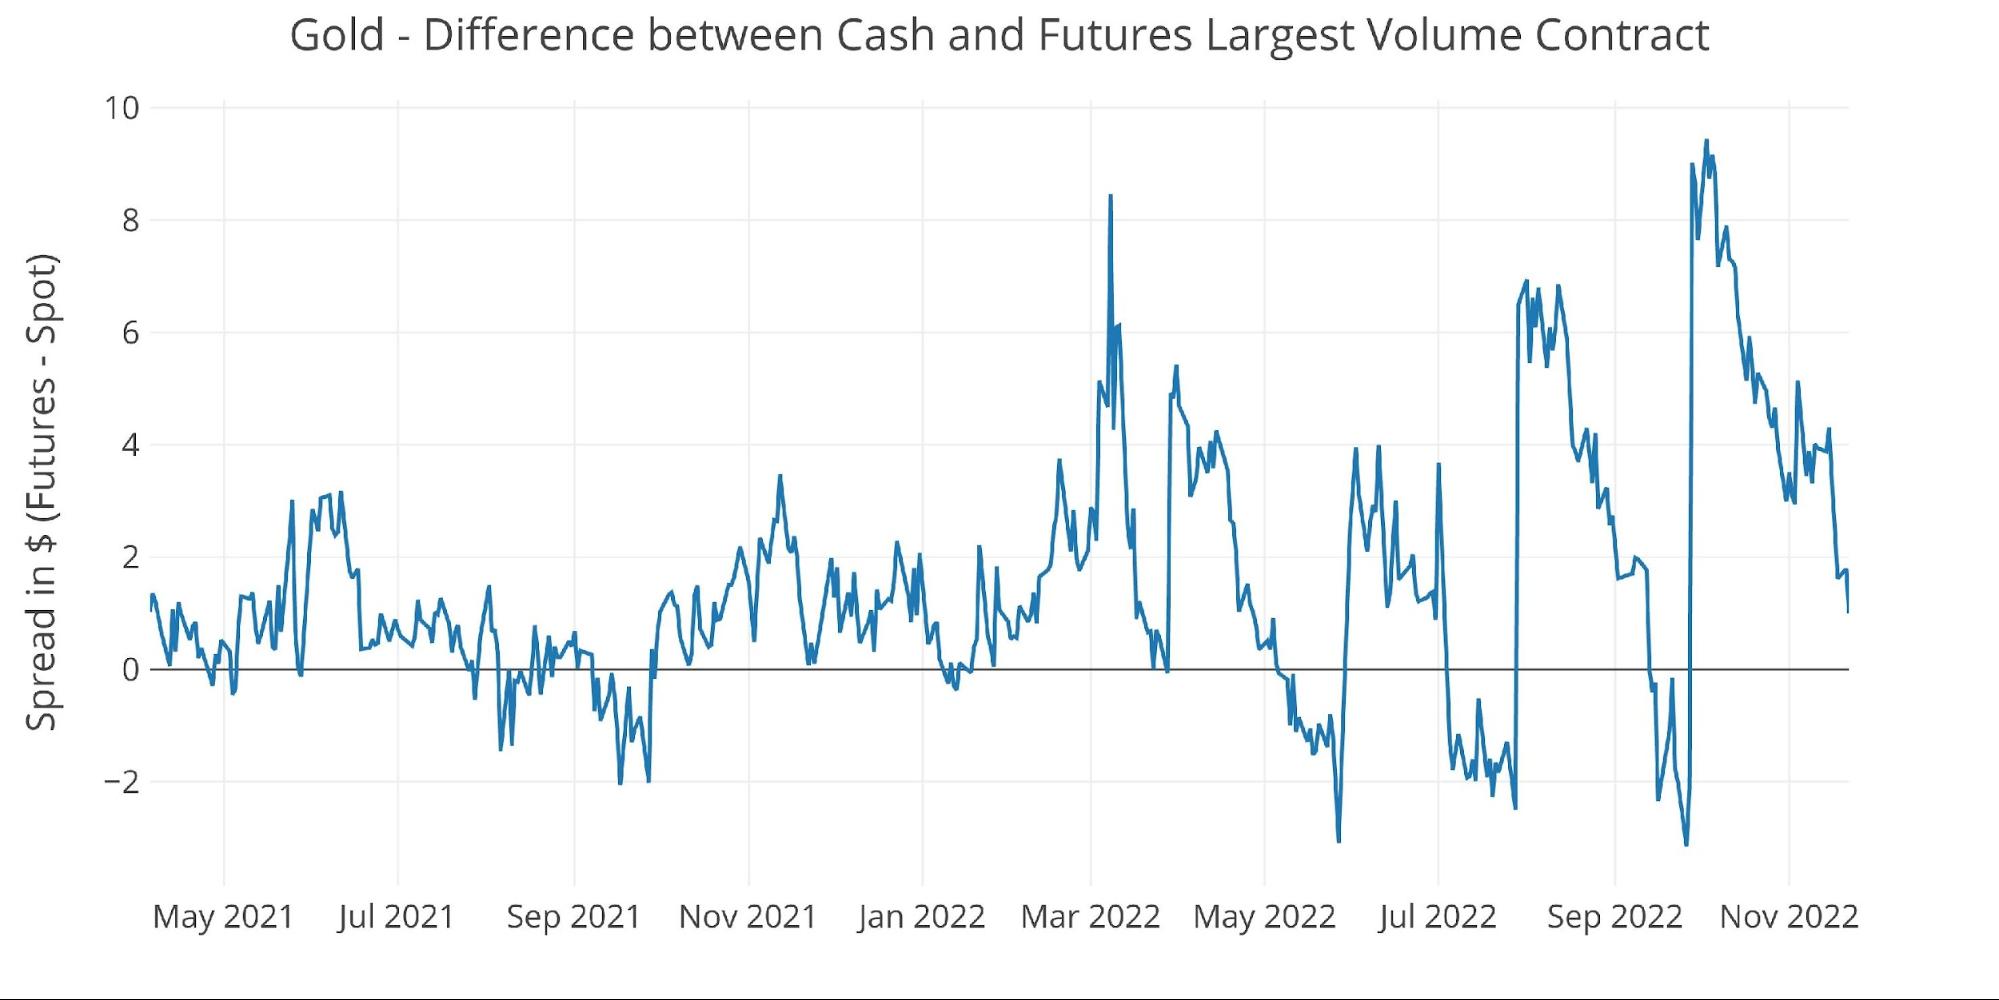
Figure: 12 Spot vs Futures
Silver: Recent Delivery Month
While gold deliveries continue to show strength with records still being set (i.e., September), silver delivery volume has fallen off a cliff. Delivery volume is on pace to be the smallest since June 2020.
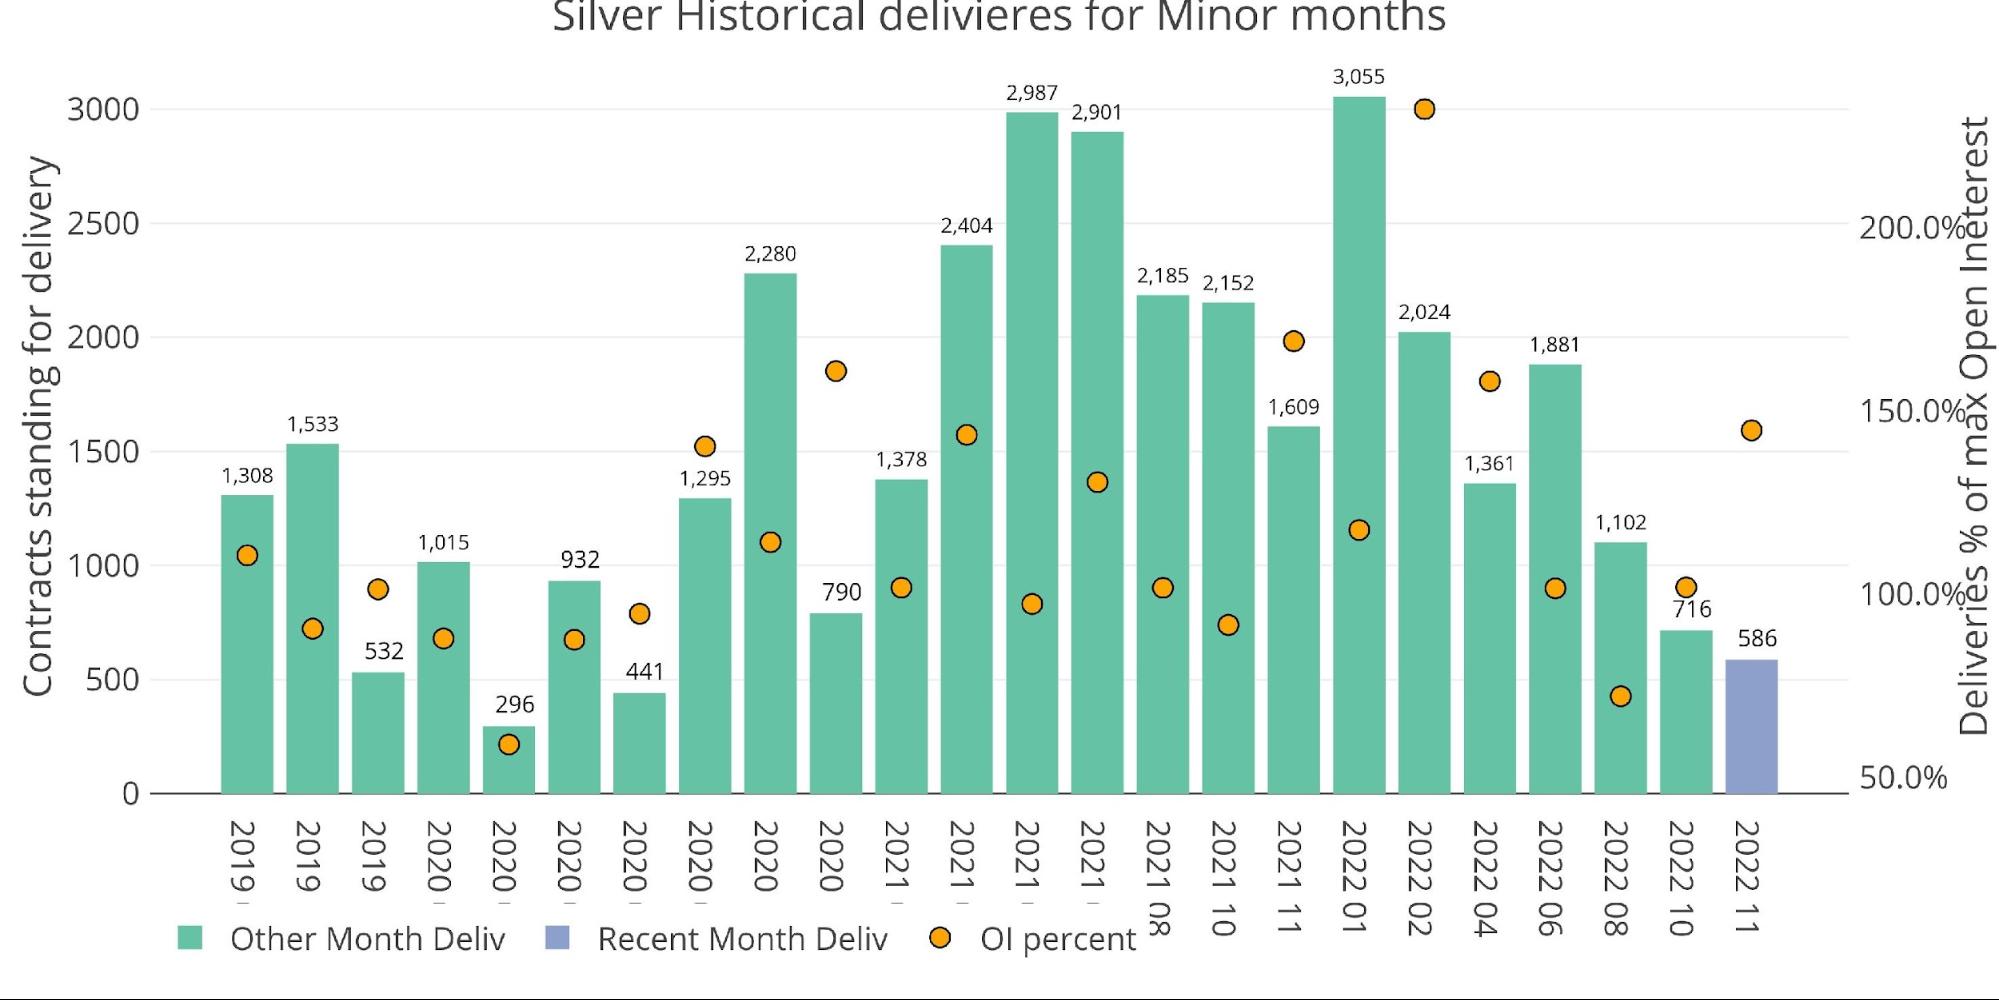
Figure: 13 Recent like-month delivery volume
This is mostly because there was very meager open interest outstanding at First Notice (green bars below). There are still 81 contracts yet to be delivered, but this is relatively small and will not materially move the needle.

Figure: 14 24-month delivery and first notice
That said, NNC activity has picked up in recent days and is in the middle of the pack.
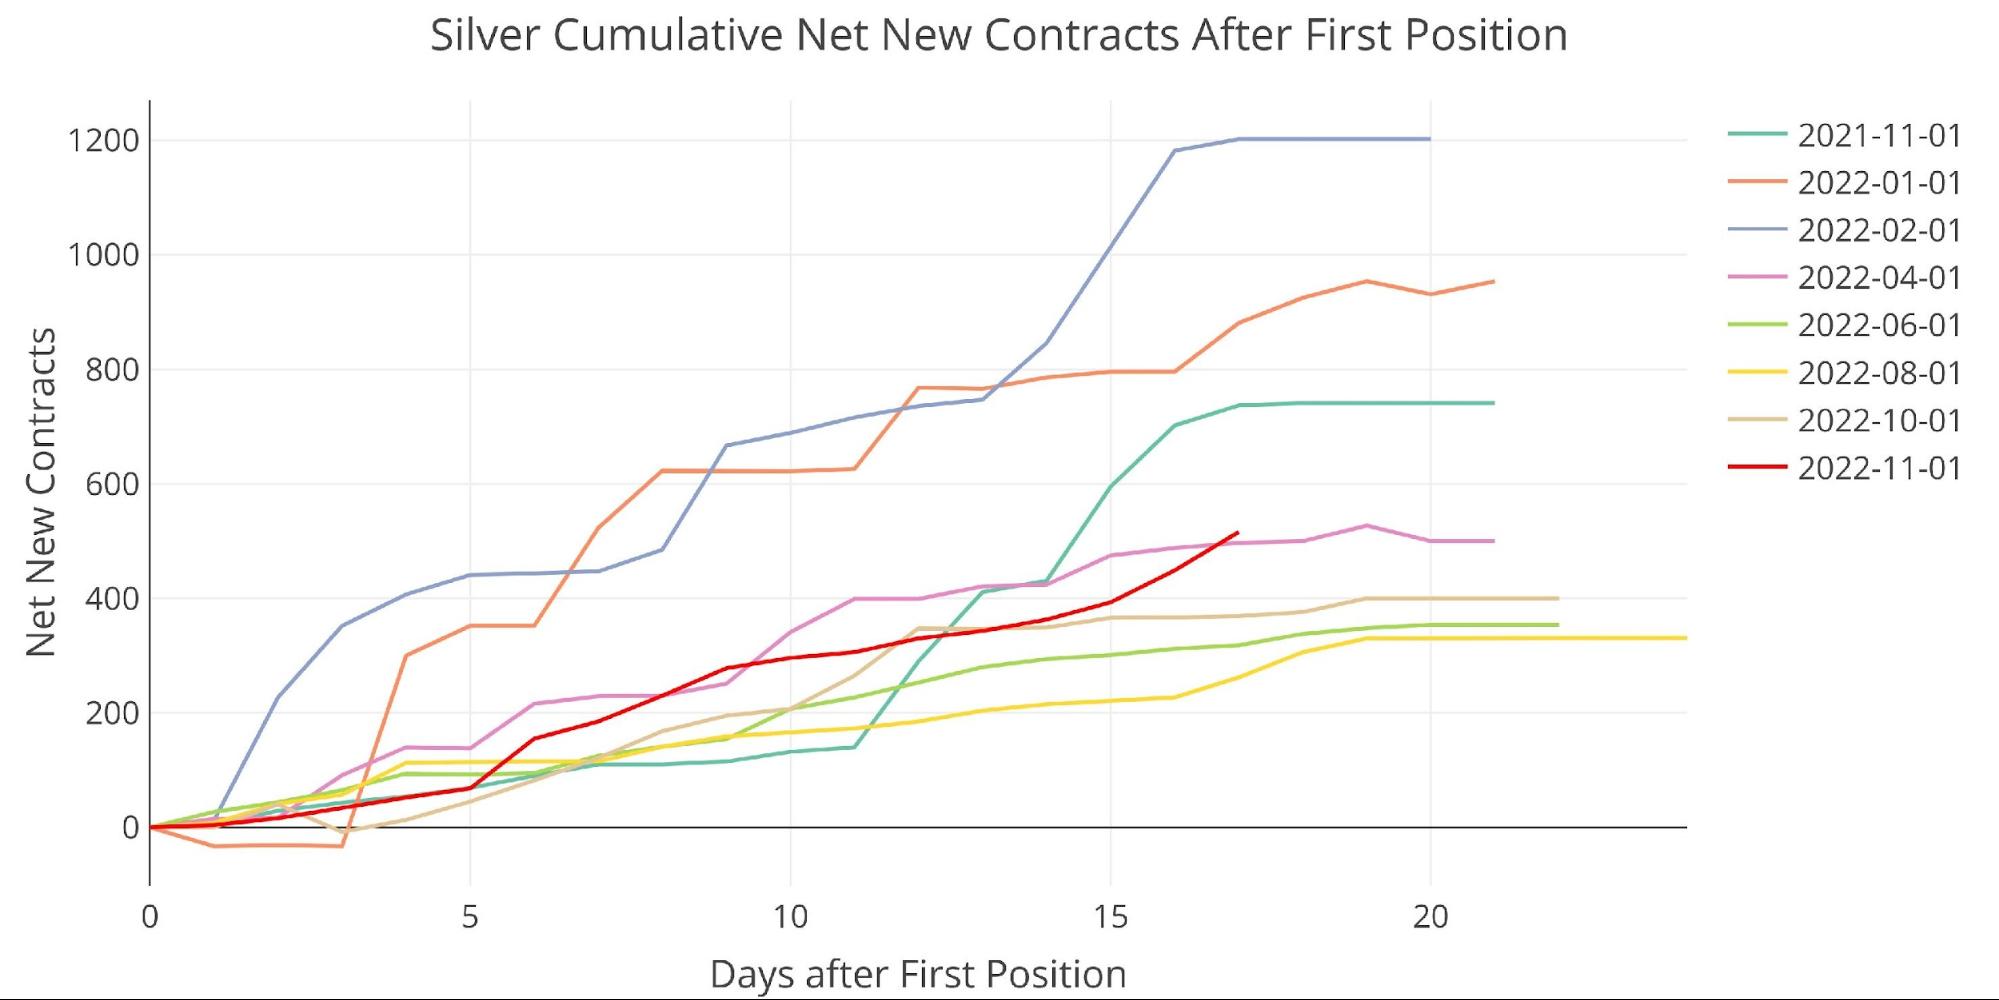
Figure: 15 Cumulative Net New Contracts
Similar to gold, the bank house accounts have completely left the market. They have only delivered 204 total silver contracts (zero for BofA). This is the lowest activity since October 2021 but is a massive fall from what was seen for much of 2022.
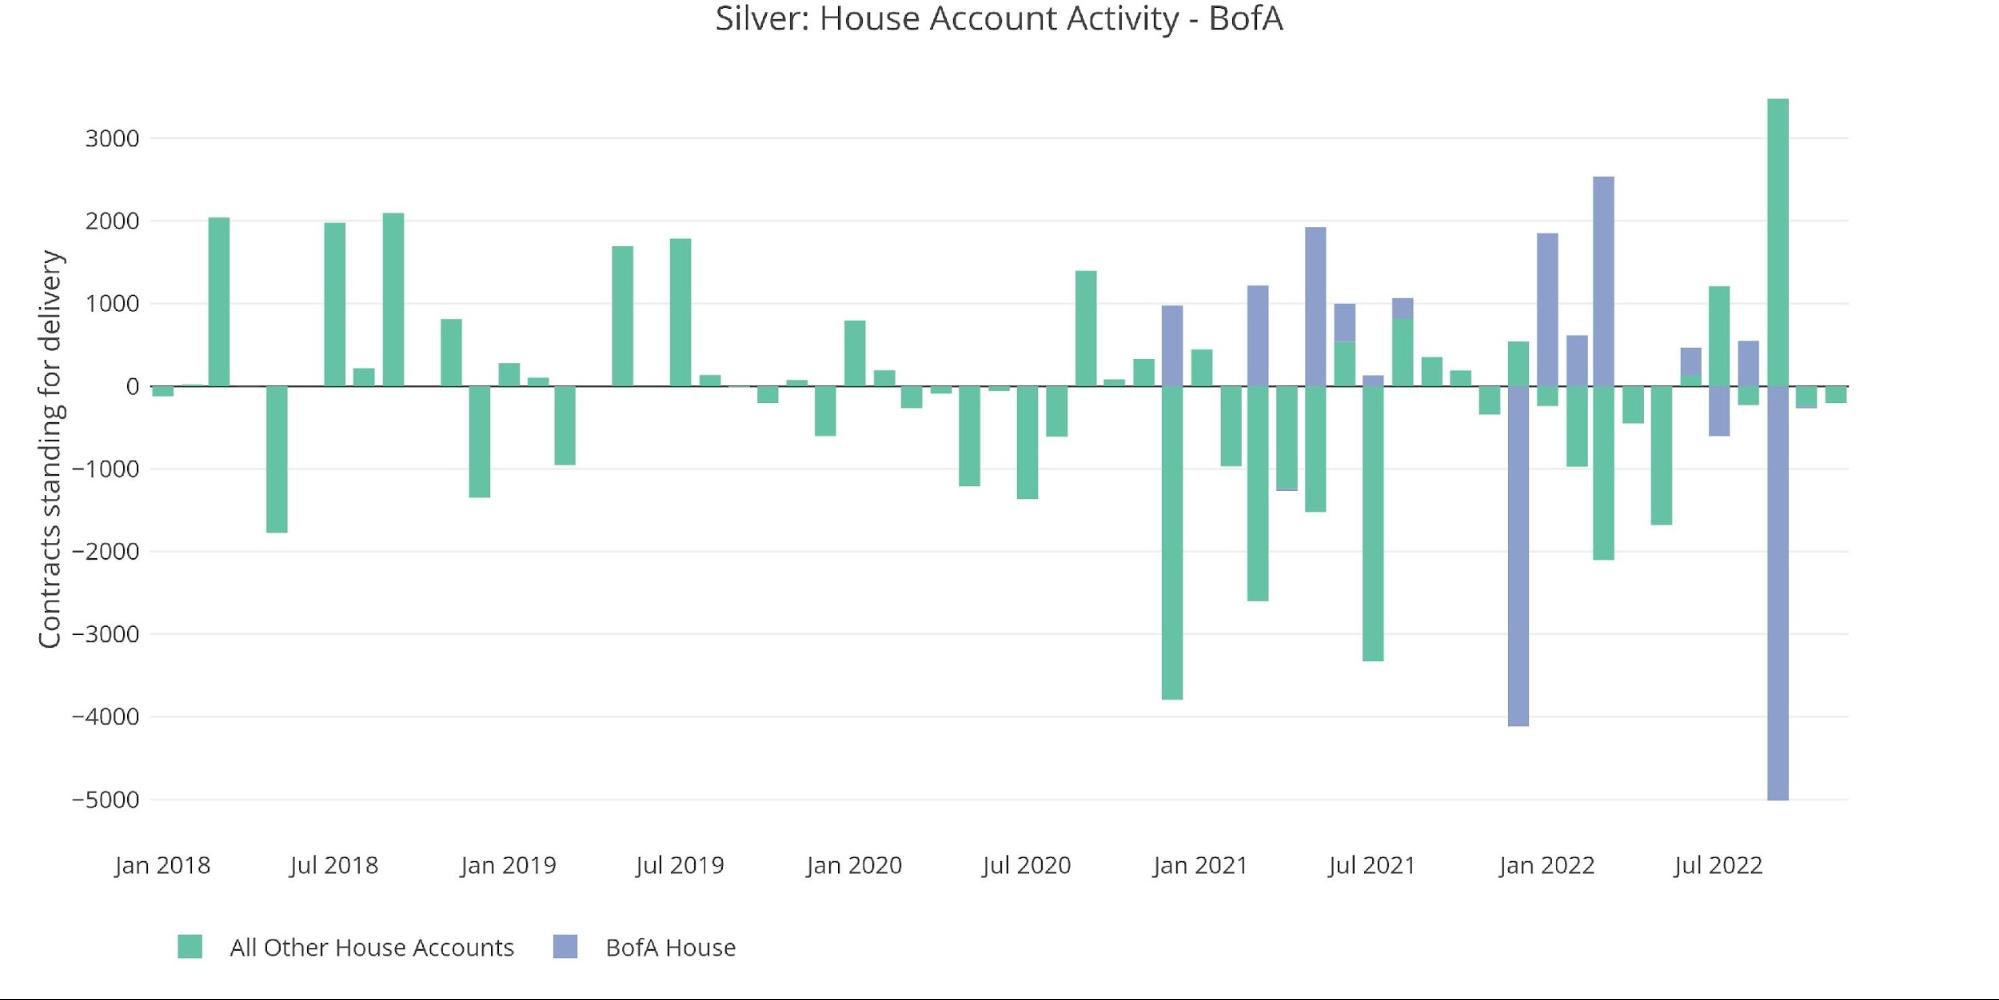
Figure: 16 House Account Activity
From a dollar perspective, this November will be below even Nov 2017 and Nov 2018, which occurred before the Covid-driven increase in delivery volume.
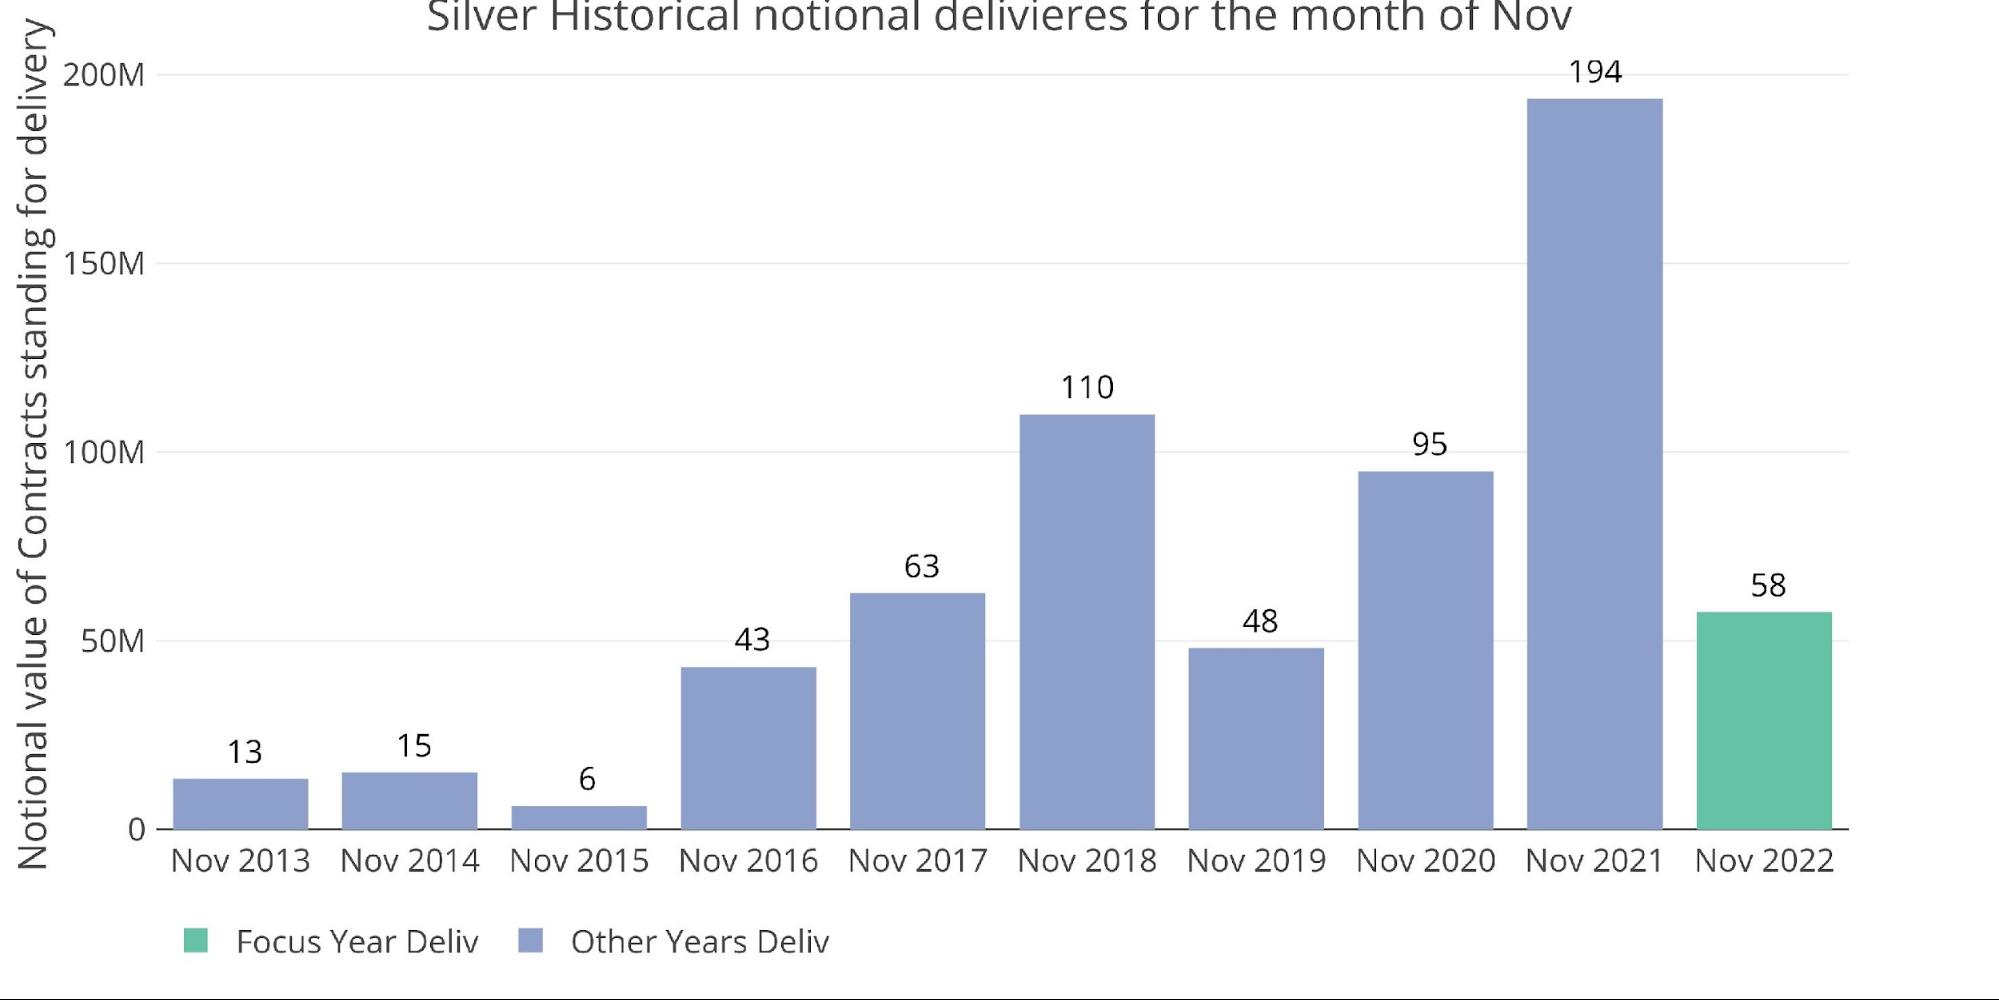
Figure: 17 Notional Deliveries
Once again, the sudden drop in delivery activity could be linked to rapidly shrinking supplies of silver at the Comex. Since July 1st, Registered has lost 33M ounces of silver. With only 35M ounces remaining, a repeat of the last 4.5 months will completely wipe out the Comex silver Registered inventory.
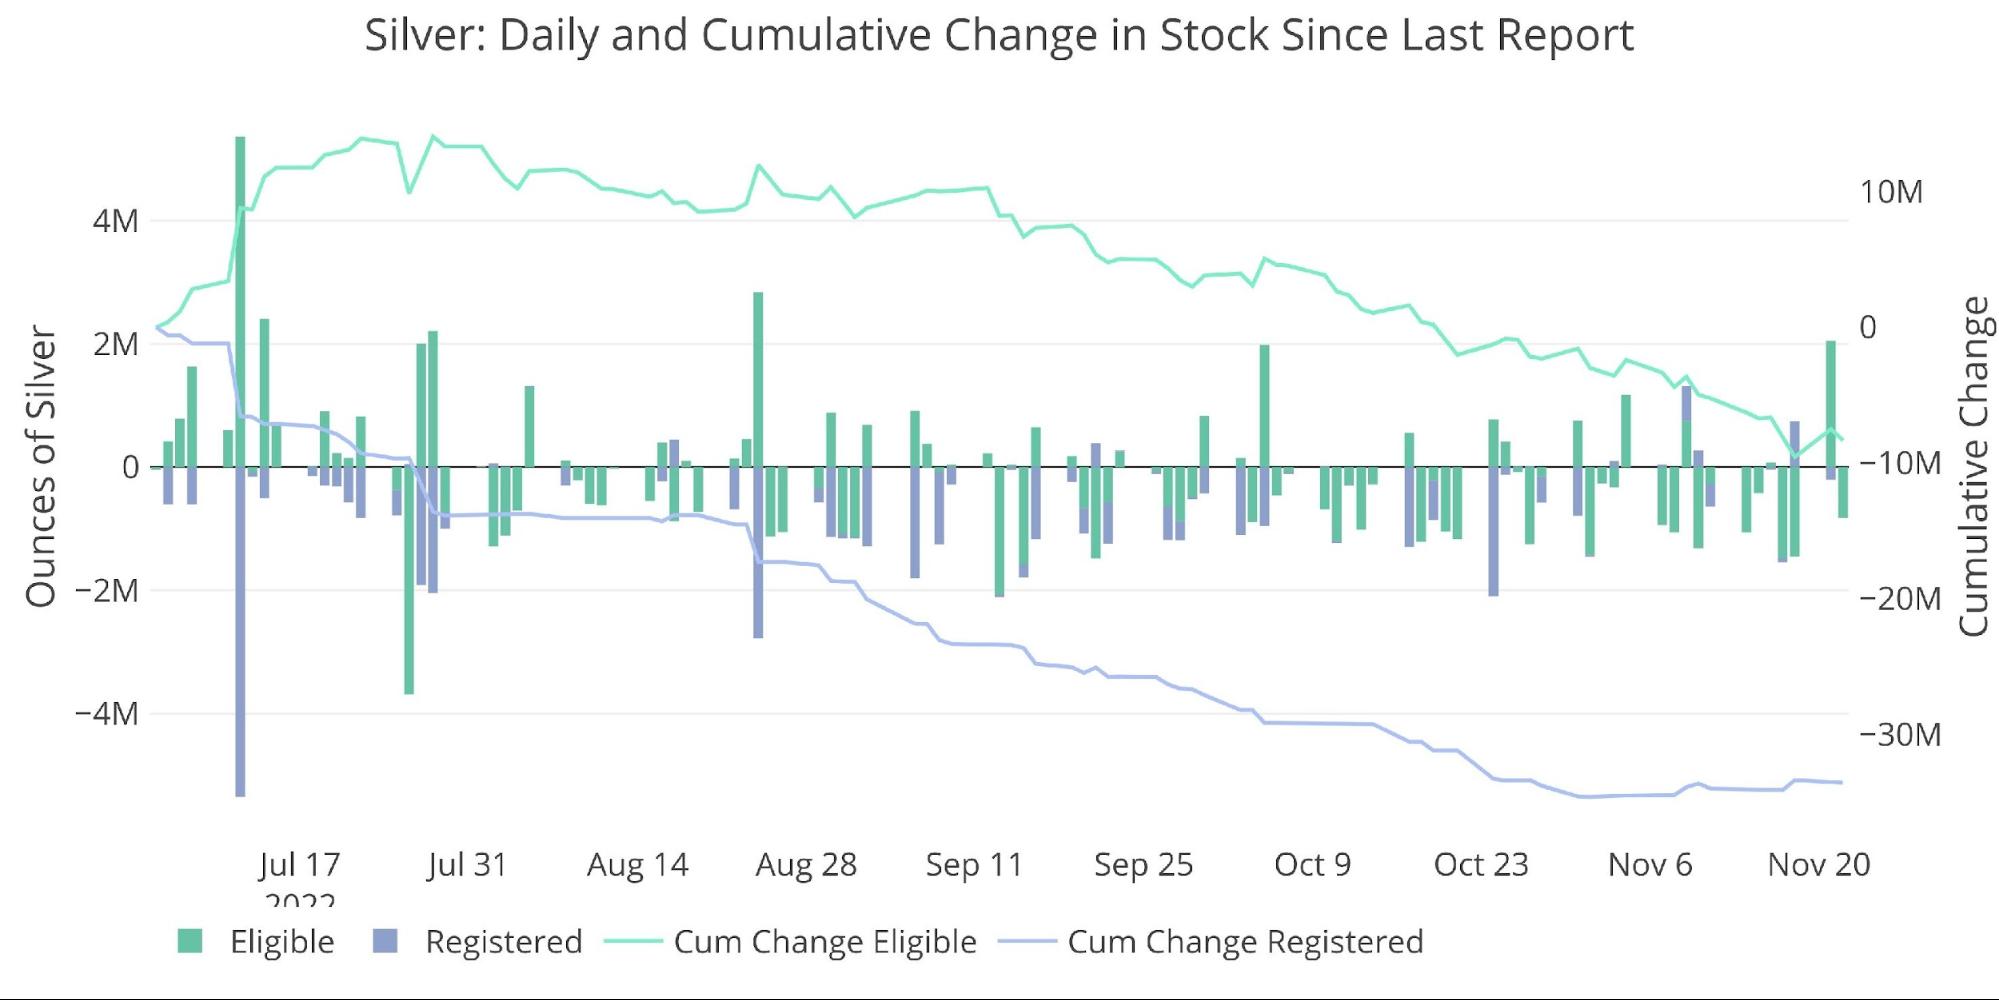
Figure: 18 Recent Monthly Stock Change
Silver: Next Delivery Month
Heading into December, silver is showing some strength. It is on the lower end of the recent major months, but near the average.
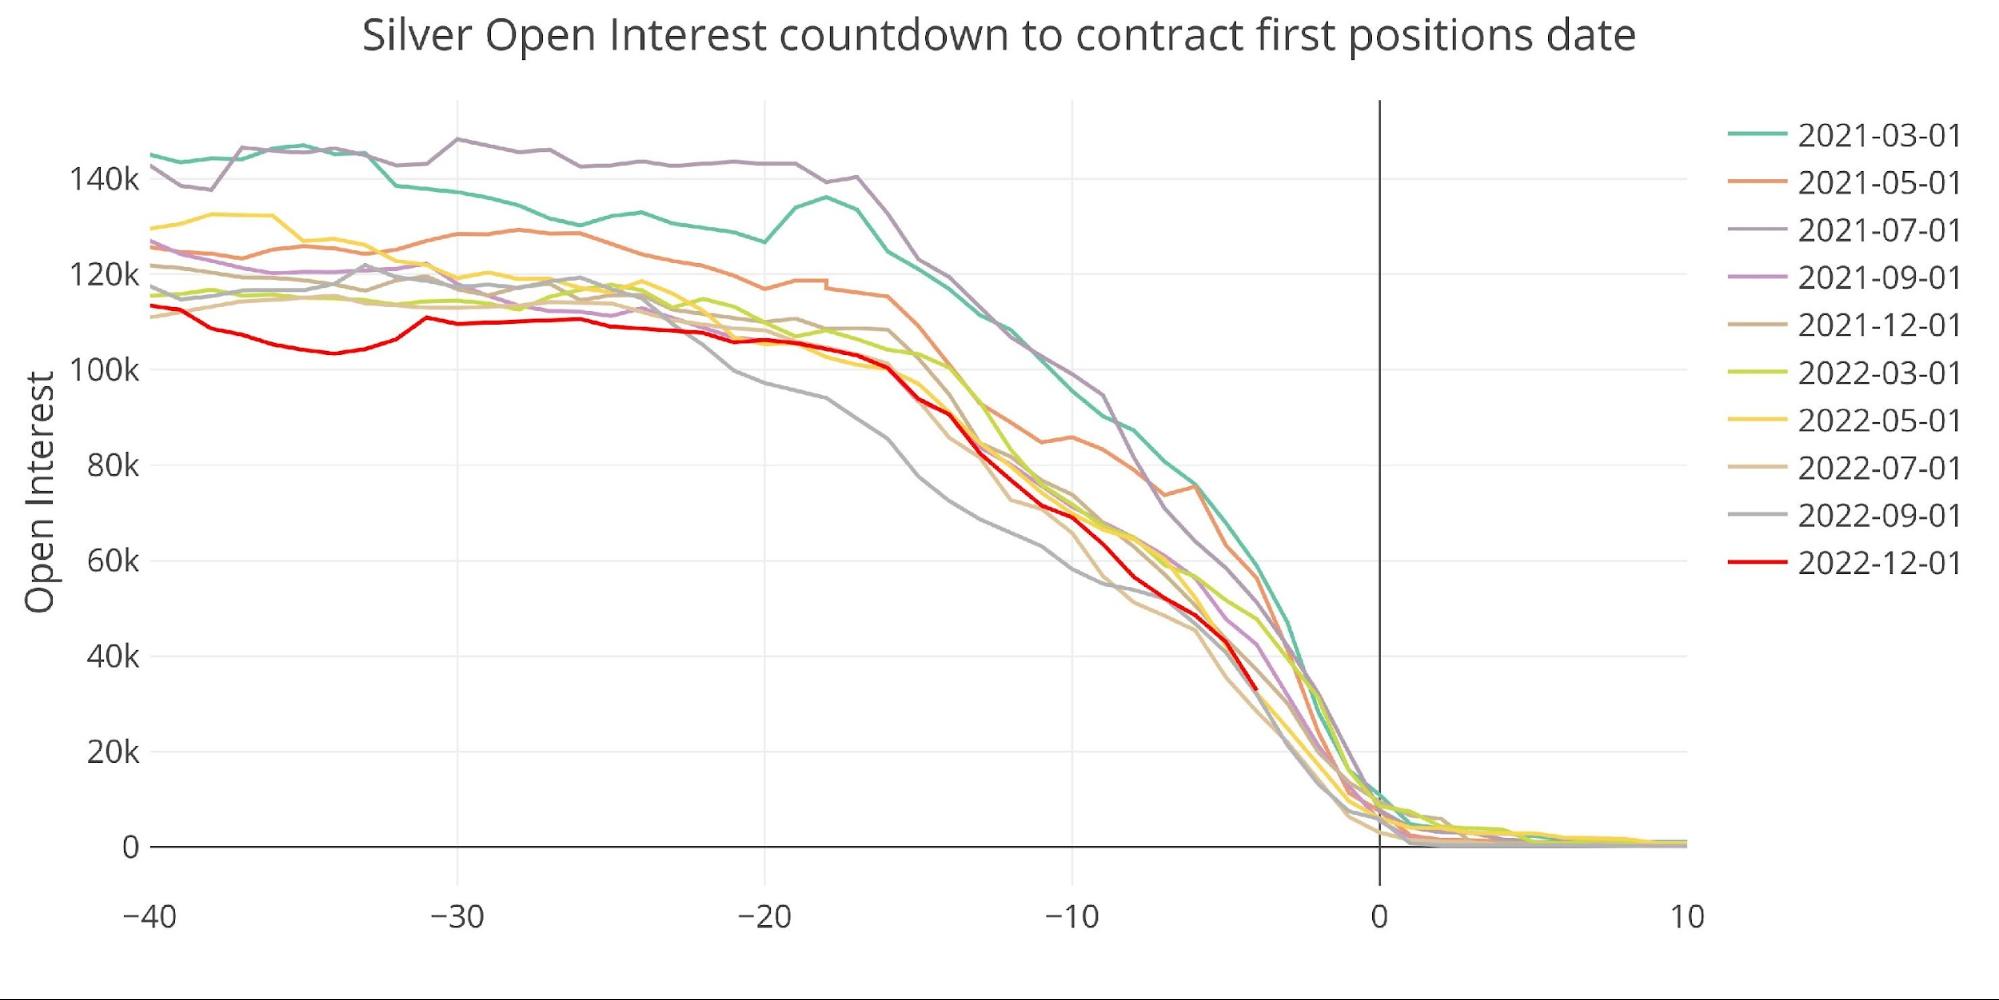
Figure: 19 Open Interest Countdown
That said, when we plot the same graph as a percentage of Registered, you can see that this month is actually much bigger than any previous month. With 4 days to go, the amount of open interest is 459% of total Registered supplies!
The contract will continue to dive into First Notice, but this chart shows just how much impact the drainage of Registered has had.

Figure: 20 Countdown Percent
Spreads
Another thing to note is that silver is in the strongest contango seen in some time.

Figure: 21 Roll Cost
The spot market has also finally moved out of backwardation.
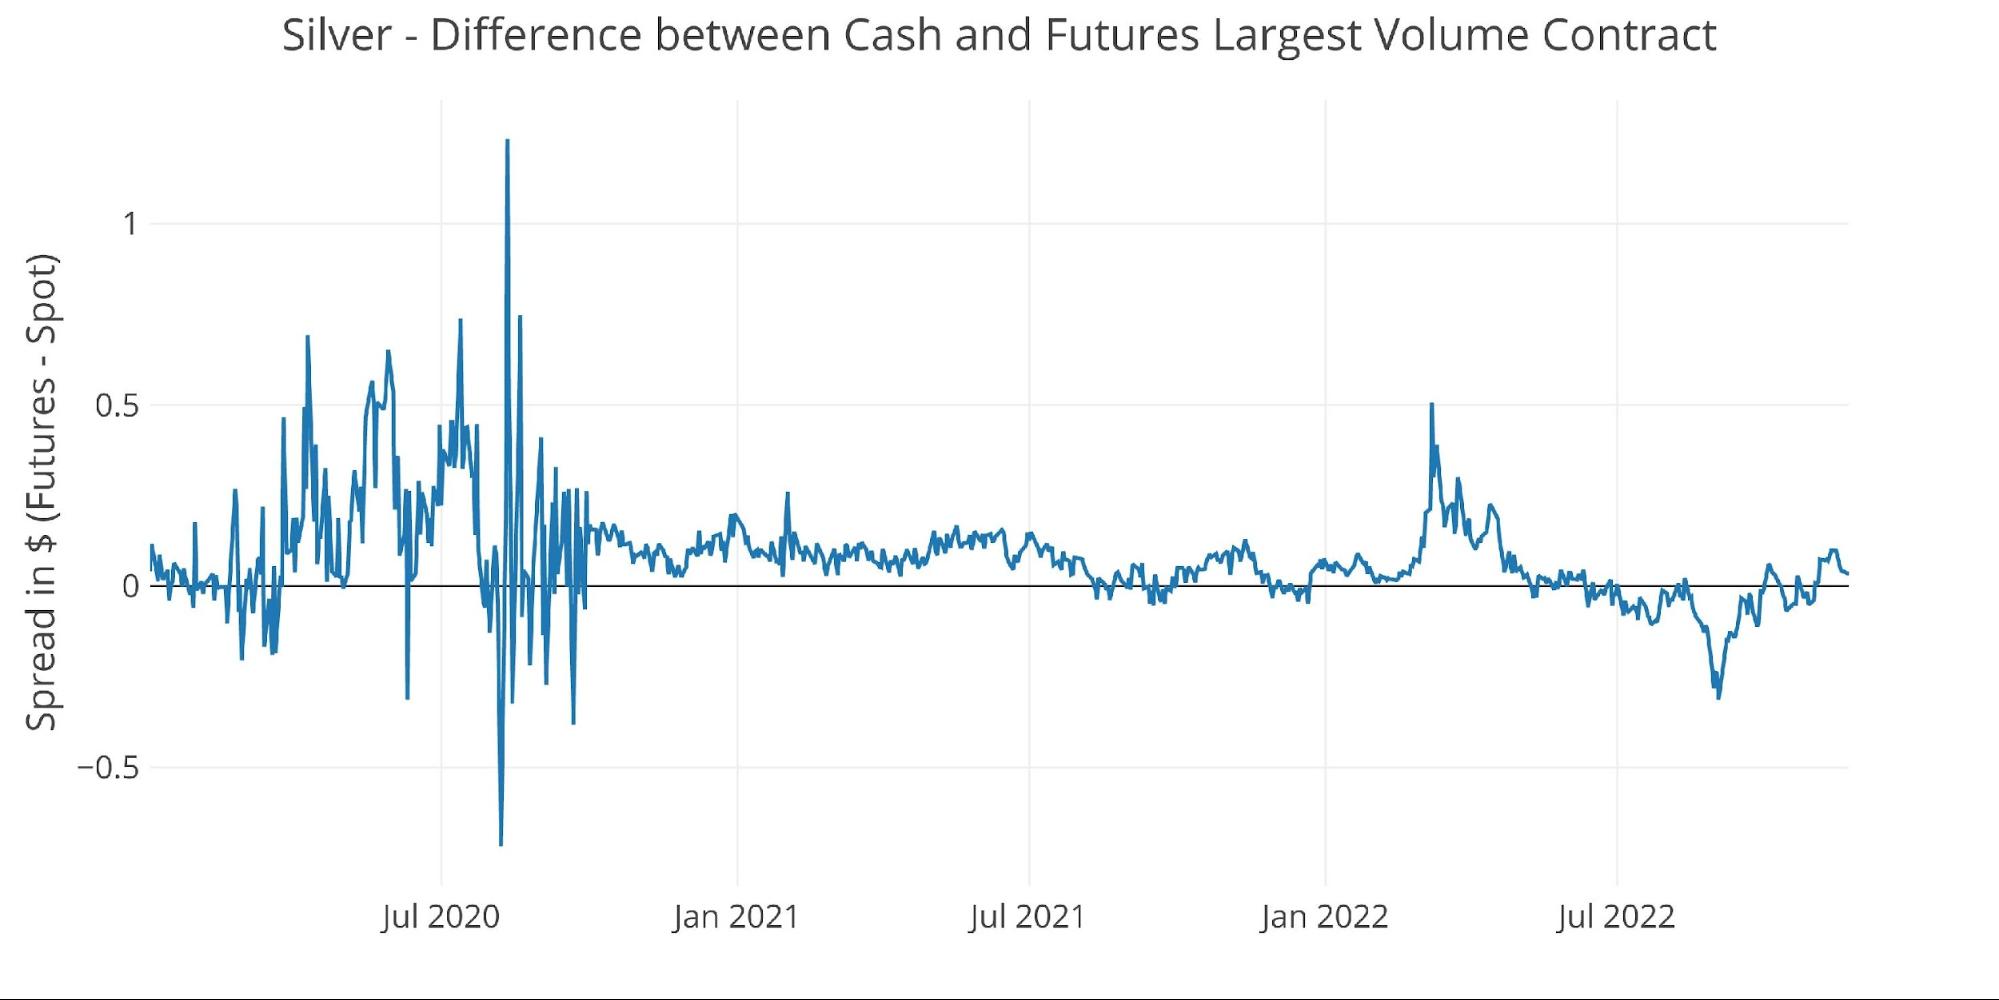
Figure: 22 Spot vs Futures
Palladium
Palladium is entering its major delivery month in December as well. As shown below, delivery volume has been averaging about 200 contracts per month.
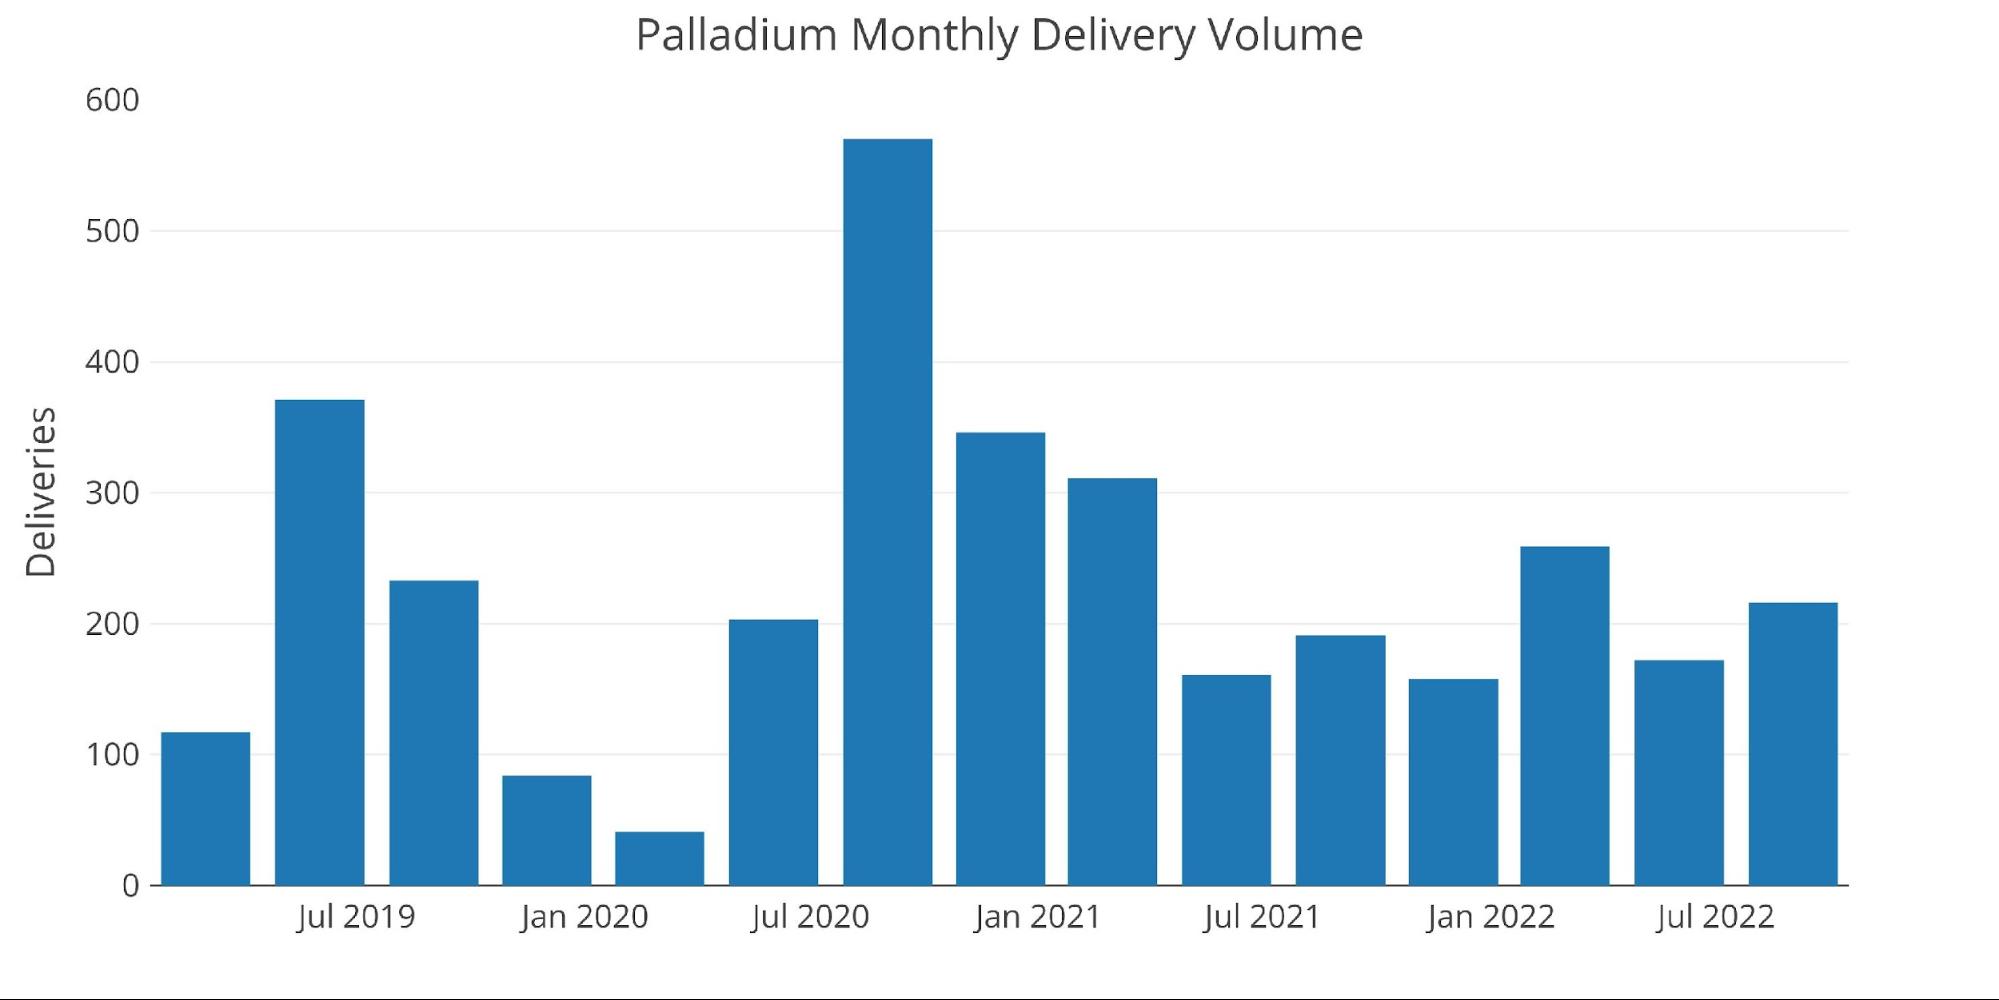
Figure: 23 Palladium Delivery Volume
Similar to gold and silver, palladium has seen falls in physical inventory. Most of this has occurred on the Eligible side as palladium still has ~50k available ounces in Registered (or about 500 contracts worth).
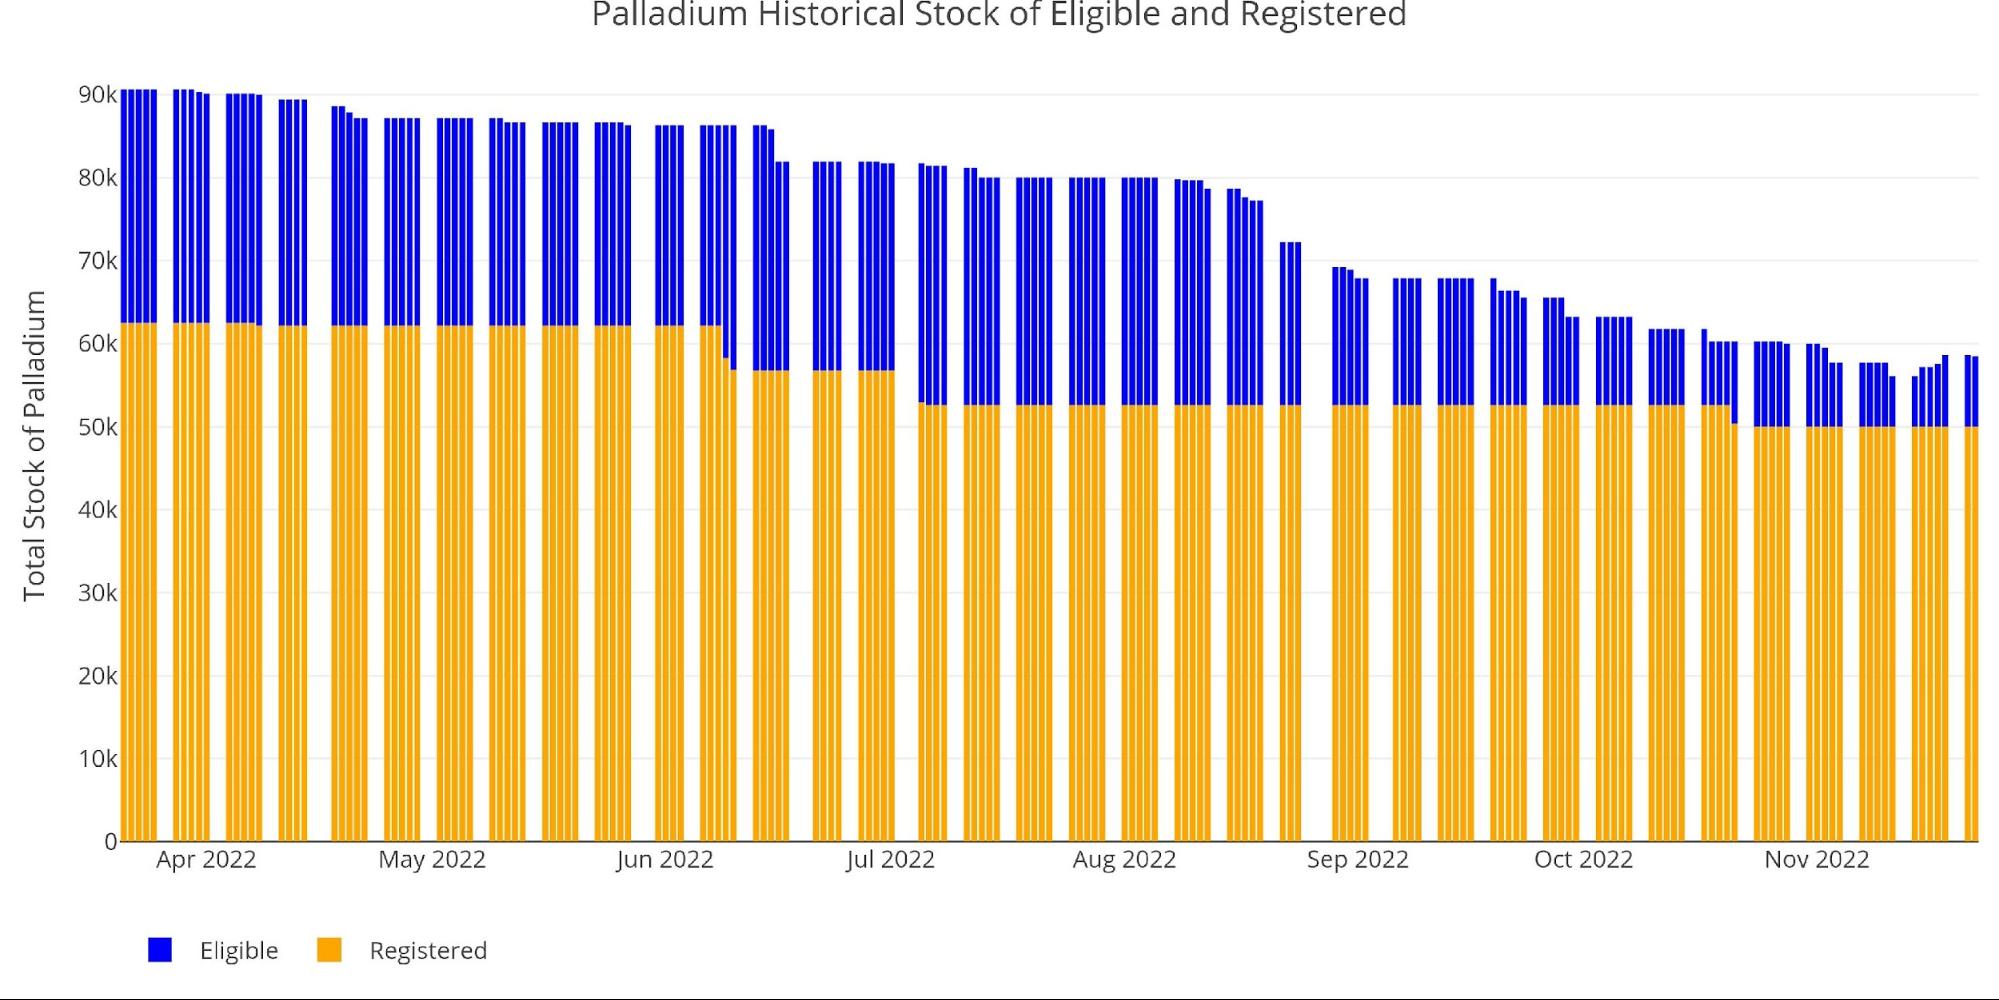
Figure: 24 Palladium Inventory
Looking at the current open interest countdown shows that the contract is currently in the dive phase as it approaches First Notice.

Figure: 25 Open Interest Countdown
If the chart is zoomed in and shown as a percentage of available Registered, it shows that palladium is on the high side of recent months (482%). It should get below 100%, but the same cannot be said for Platinum which has seen a much stronger decline in Registered inventory. Stay tuned for that analysis next month as Platinum enters its major delivery month in January!
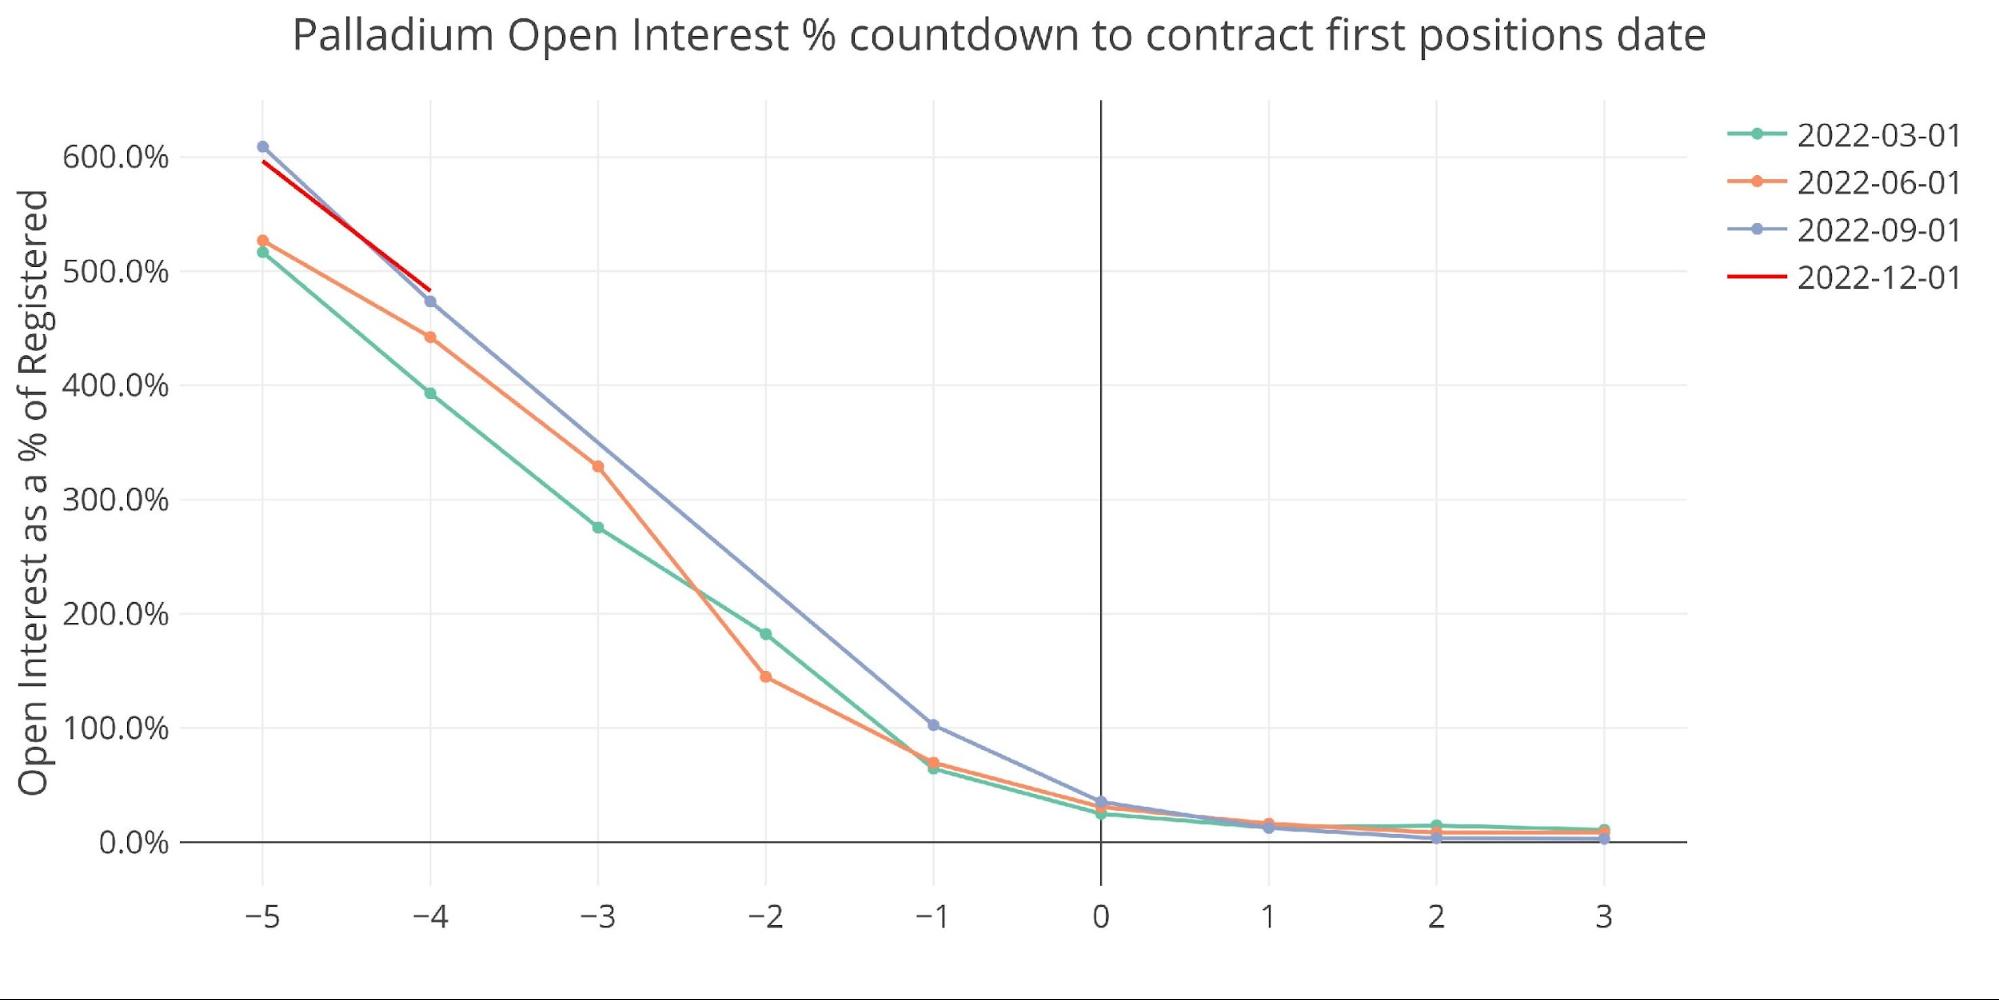
Figure: 26 Palladium Countdown Percent
Wrapping up
The data shows that inventory available for delivery is shrinking at the Comex. While there is still remaining Registered inventory in all 4 metals, it is clearly getting smaller. Furthermore, the recent activity (or lack thereof) might be due to less inventory than the Comex data suggests. Why else would gold still have so much open interest this late in the contract? Why has house account activity plummeted in both metals?
We have been tracking this data for a while. Slowly but surely, physical supplies are being drained from the Comex. This has put pressure on the system. We are now seeing that pressure manifest itself in the data.
One thing is for sure, 2023 cannot be a repeat of 2022 for the Comex or else the system will likely break. With the December contract rapidly approaching, it will likely set the tone for 2023. The squeeze in physical supplies is happening slowly, but make no mistake it is happening. 2023 could be an epic year. Astute investors would front-run this move and get physical metal while it is still available at current prices.
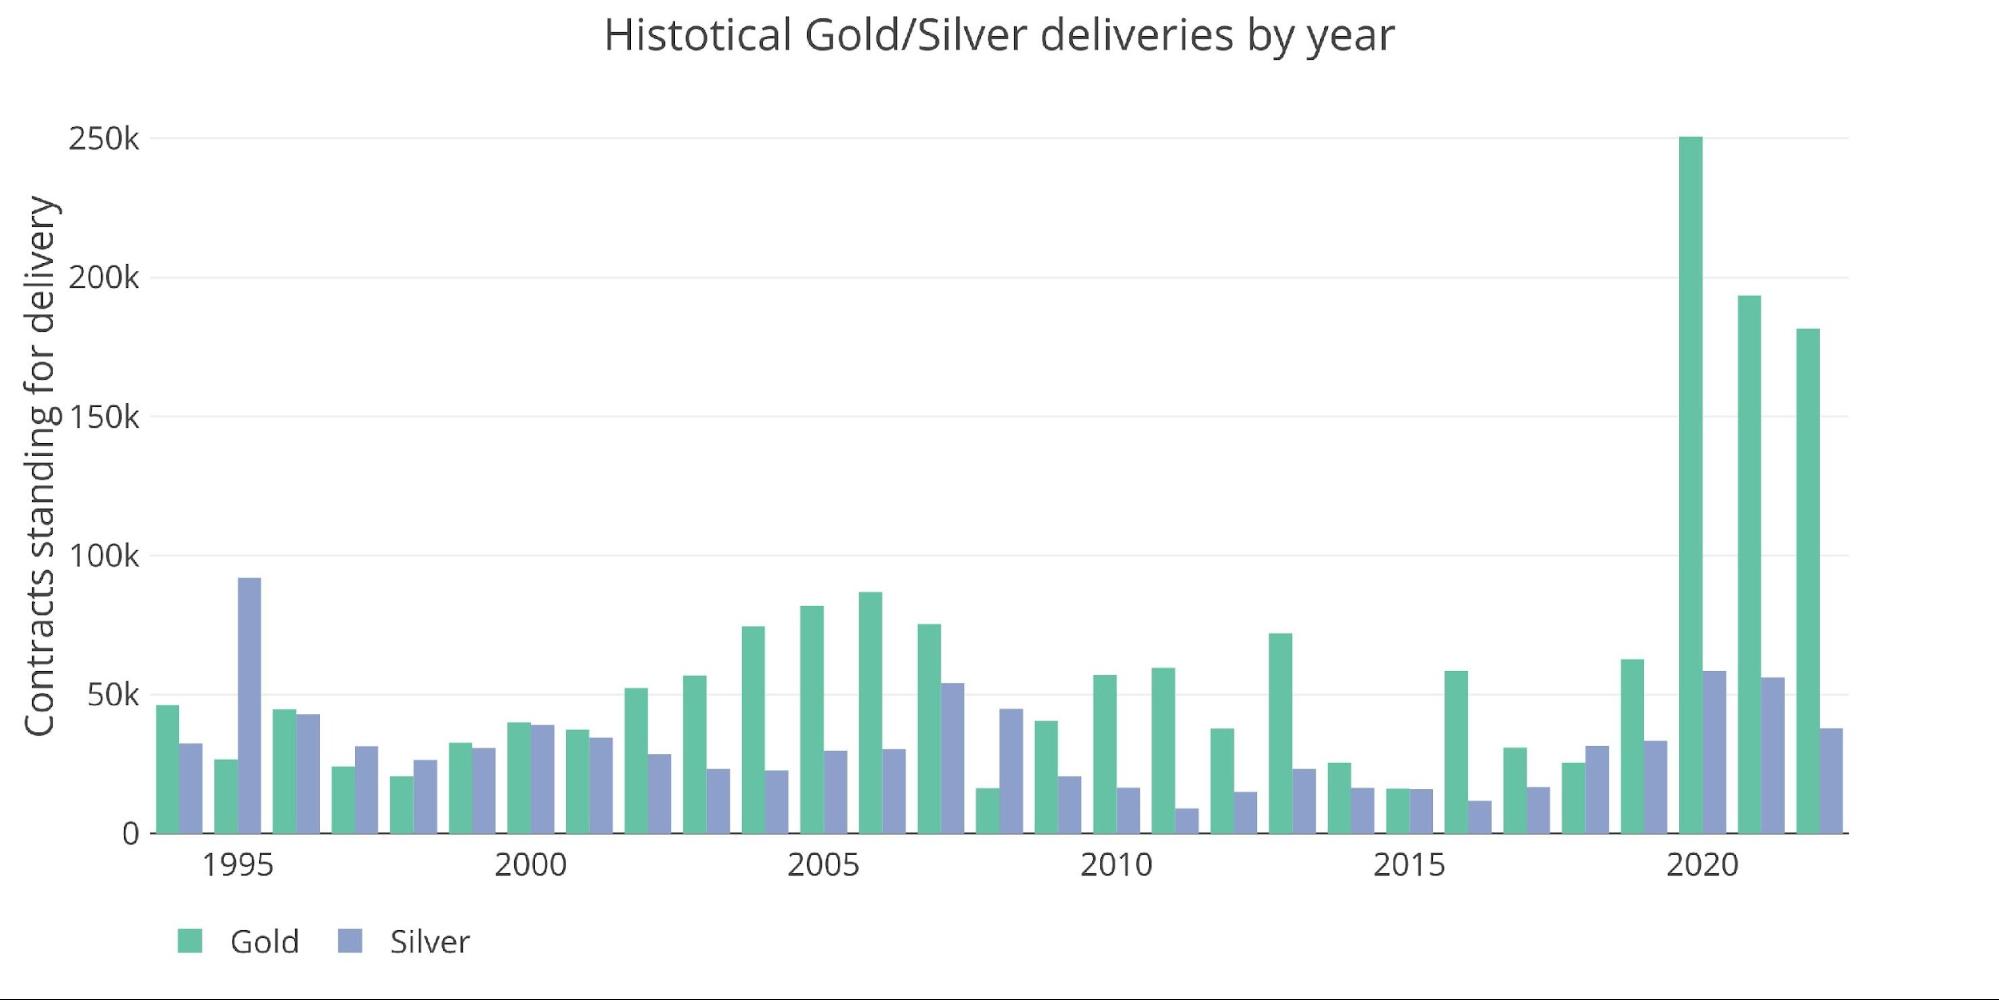
Figure: 27 Annual Deliveries
Data Source: https://www.cmegroup.com/
Data Updated: Nightly around 11 PM Eastern
Last Updated: Nov 22, 2022
Gold and Silver interactive charts and graphs can be found on the Exploring Finance dashboard: https://exploringfinance.shinyapps.io/goldsilver/
More By This Author:
China Likely Stockpiling Gold To Minimize Dollar DependenceMore Economic Data Confirms A Recession
Treasury Market Liquidity And Volatility Problems Could Derail Fed Balance Sheet Reduction


