
If The Correction Is Over, It Can Mean One Thing For The Gold Price
Will the combination of gold, the USDX’s, and the S&P 500's recent behavior resume the downtrend in the gold market?
Magical 38.2%
In today’s analysis, I’ll cover other parts of the current puzzle: gold, the USD Index, and the stock market. In particular, the situation appears very interesting in the latter, so I’ll start with it.
(Click on image to enlarge)
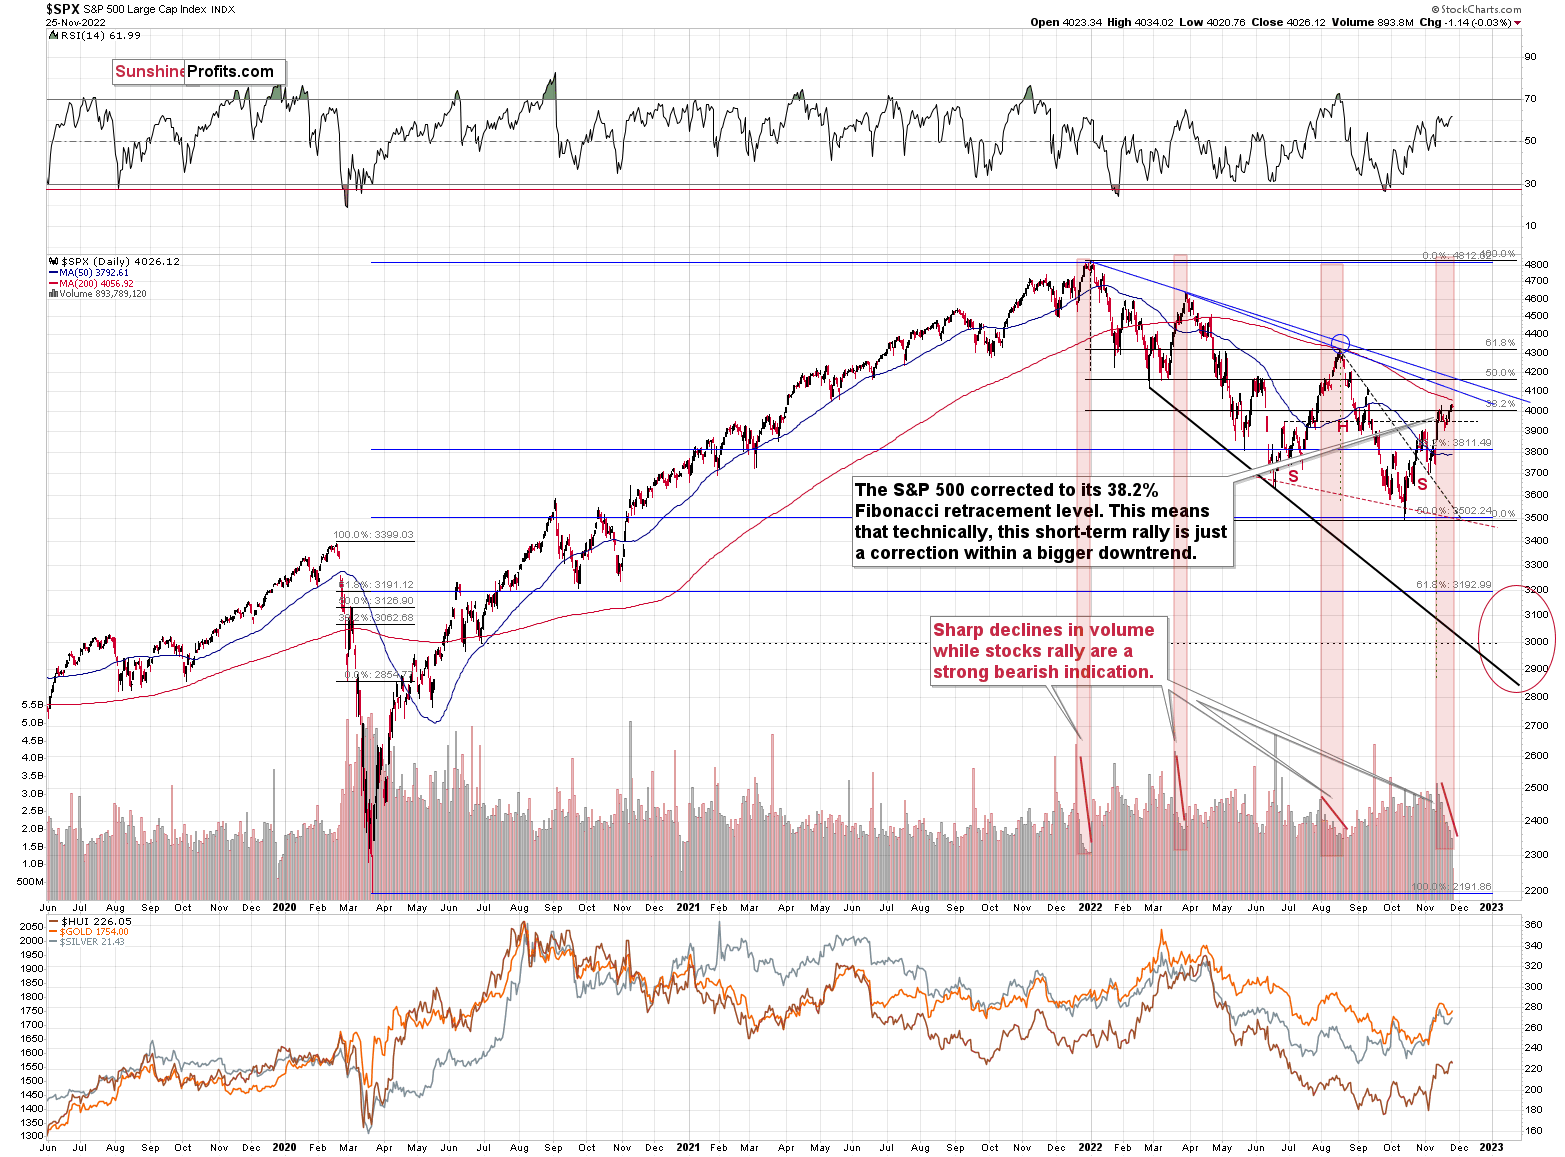
We just saw a small attempt to break above the 38.2% Fibonacci retracement, and I doubt that this breakout will be confirmed. The “why” behind it is currently the most interesting analogy that we see in this market.
Please take a look at the areas marked with red rectangles. In all those cases, the S&P 500 index rallied on big volume at first, and then the volume declined over the course of a few weeks. And as that happened, the price approached its top.
All three previous important tops that we saw this year were accompanied by this indication.
We also see it right now.
Even more interestingly, the volume levels that have just been seen are similar to the ones that accompanied previous tops.
Consequently, it seems that the end of the rally is near. This is likely to have very bearish implications for junior mining stocks.
Let’s check what’s up with gold.
(Click on image to enlarge)
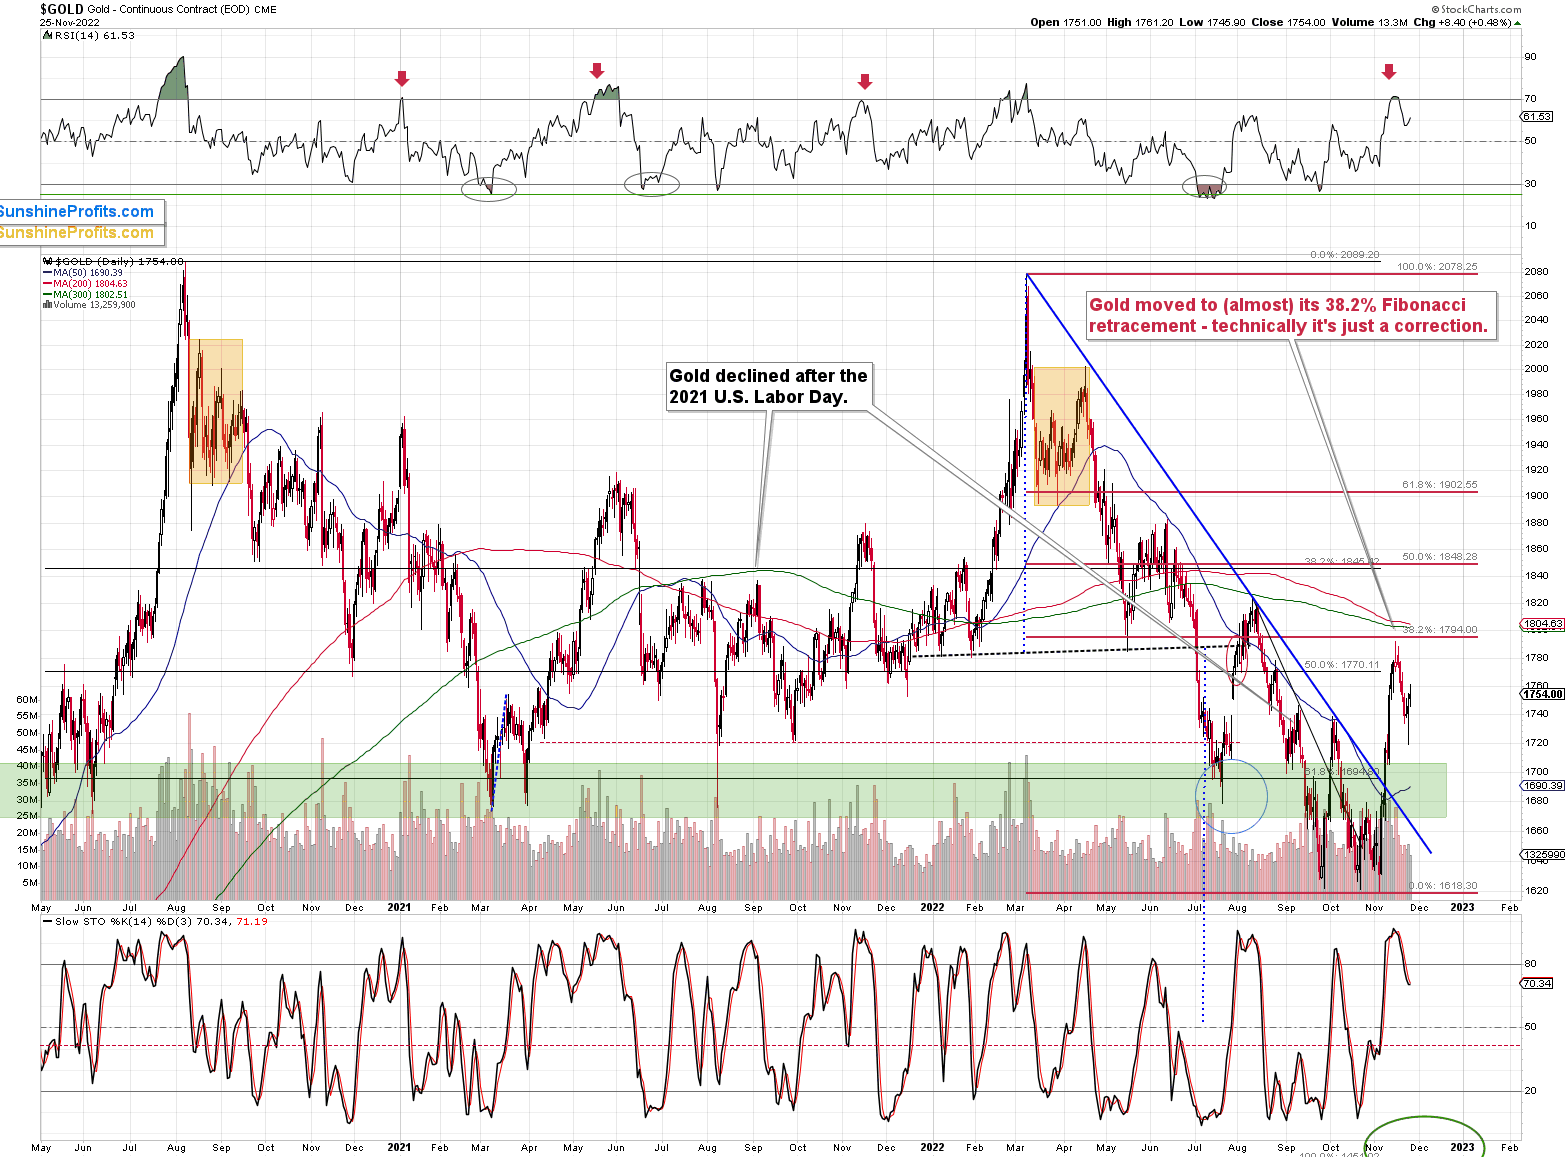
The yellow metal corrected 38.2% of its previous medium-term decline, and it declined once again. The moves that are smaller than 38.2% of the preceding move are generally viewed as “weak corrections,” indicating a market where the previous trend is very strong.
What’s Next?
As the correction appears to be over, the medium-term downtrend is now likely to resume. The RSI indicator clearly supports this outcome, as it just moved back below 70. When we previously saw similar signals, gold prices usually plunged.
There’s one more thing that makes me predict that the gold price top is already in.
It’s gold’s link with the USD Index.
(Click on image to enlarge)
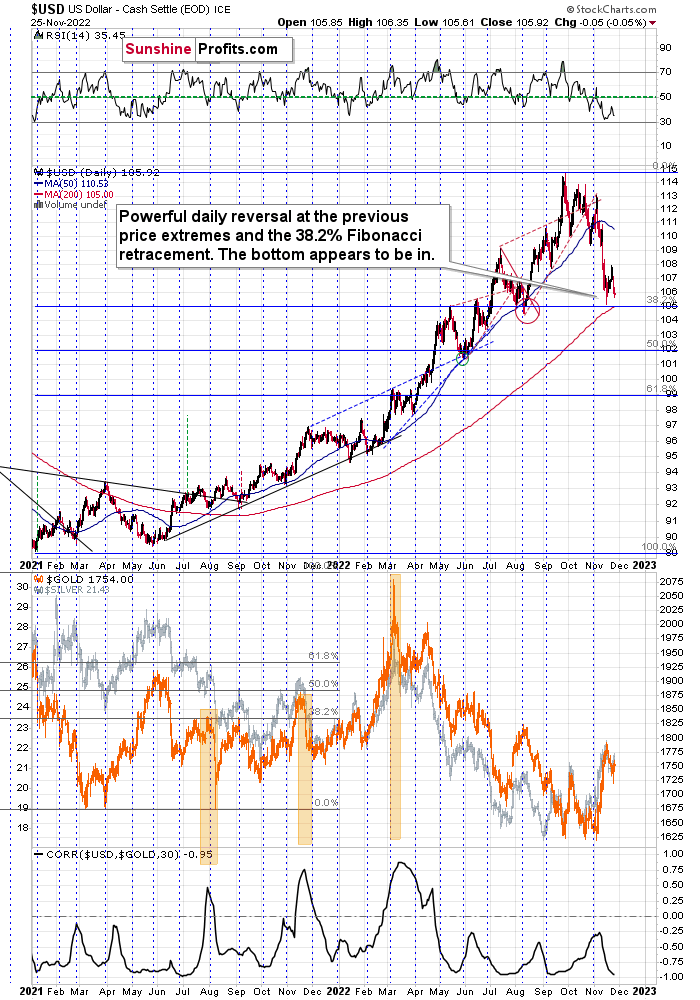
As you can see above, the USD Index just moved very close to its recent bottom. However, at the same time, gold and silver prices didn’t move back to their previous highs.
This kind of weak reaction to a factor that “should” move the market, indicates that the market really wants to move in the opposite direction.
In the current case, this indicates that gold wants to move lower.
Combining the above with the extremely negative correlation between gold and the USD Index (currently the 30-trading-day linear correlation coefficient is at -0.95, while -1 is the most negative that it could go), this indicates that when the USD Index rallies, gold would be likely to truly plunge – magnifying the U.S. dollar’s moves, but in the opposite direction.
All in all, the technical outlook for the precious metals sector appears to be very bearish for the coming weeks.
More By This Author:
Could Bitcoin’s Movements Indicate The Fall Of Junior Gold Stocks?
If Gold Started Plunging, Is The Miners’ Fate Already Sealed?
Gold Price Formed A Bearish Star, And It’s Not Even Christmas Yet
Disclaimer: All essays, research and information found on the Website represent the analyses and opinions of Mr. Radomski and Sunshine Profits' associates only. As such, it may prove wrong ...
more

