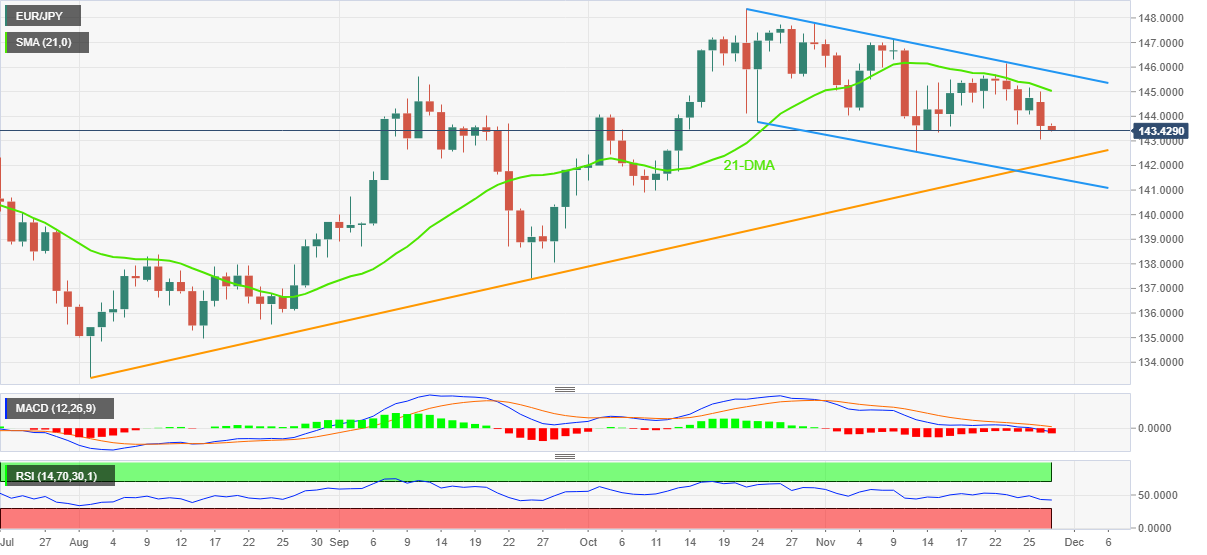
- EUR/JPY takes offers to refresh intraday low, extends pullback from 21-DMA.
- Bearish MACD signals, downbeat RSI also favors sellers targeting ascending trend line from early August.
- Monthly bearish channel keeps the downside bias intact.
EUR/JPY renews its intraday low around 143.30 while extending the week-start fall during early Tuesday.
In doing so, the cross-currency pair also justifies the sustained trading below the 21-DMA and downbeat MACD signals, as well as softer RSI (14), to keep the bears hopeful inside a one-month-old bearish channel.
That said, an upward-sloping support line from early August, around 142.10 by the press time, appears imminent support for the EUR/JPY bears to watch.
Following that, the stated descending channel’s lower line, close to 141.50, will be in focus.
Alternatively, the 21-DMA hurdle surrounding 145.00 could challenge the short-term recovery of the EUR/JPY pair ahead of highlighting the bearish channel’s upper line, close to 145.85 at the latest.
In a case where the pair buyers manage to cross the 145.85 hurdle, the 146.00 round figure may act as an intermediate halt during the run-up towards the previous monthly top of 148.40.
Overall, EUR/JPY is likely to remain weak inside a short-term bearish chart formation while a multi-day-old support line lures the downside momentum of late. It should be noted, however, that, the 141.50 is the key support to watch before ruling out the odds of the pair’s rebound.
EUR/JPY: Daily chart
Trend: Further downside expected
Information on these pages contains forward-looking statements that involve risks and uncertainties. Markets and instruments profiled on this page are for informational purposes only and should not in any way come across as a recommendation to buy or sell in these assets. You should do your own thorough research before making any investment decisions. FXStreet does not in any way guarantee that this information is free from mistakes, errors, or material misstatements. It also does not guarantee that this information is of a timely nature. Investing in Open Markets involves a great deal of risk, including the loss of all or a portion of your investment, as well as emotional distress. All risks, losses and costs associated with investing, including total loss of principal, are your responsibility. The views and opinions expressed in this article are those of the authors and do not necessarily reflect the official policy or position of FXStreet nor its advertisers. The author will not be held responsible for information that is found at the end of links posted on this page.
If not otherwise explicitly mentioned in the body of the article, at the time of writing, the author has no position in any stock mentioned in this article and no business relationship with any company mentioned. The author has not received compensation for writing this article, other than from FXStreet.
FXStreet and the author do not provide personalized recommendations. The author makes no representations as to the accuracy, completeness, or suitability of this information. FXStreet and the author will not be liable for any errors, omissions or any losses, injuries or damages arising from this information and its display or use. Errors and omissions excepted.
The author and FXStreet are not registered investment advisors and nothing in this article is intended to be investment advice.
Recommended content
Editors’ Picks
EUR/USD retreats below 1.0700 after US GDP data

EUR/USD came under modest bearish pressure and retreated below 1.0700. Although the US data showed that the economy grew at a softer pace than expected in Q1, strong inflation-related details provided a boost to the USD.
GBP/USD declines below 1.2500 as USD rebounds

GBP/USD declined below 1.2500 and erased the majority of its daily gains with the immediate reaction to the US GDP report. The US economy expanded at a softer pace than expected in Q1 but the price deflator jumped to 3.4% from 1.8%.
Gold drops below $2,320 as US yields shoot higher

Gold lost its traction and turned negative on the day below $2,320 in the American session on Thursday. The benchmark 10-year US Treasury bond yield is up more than 1% on the day above 4.7% after US GDP report, weighing on XAU/USD.
XRP extends its decline, crypto experts comment on Ripple stablecoin and benefits for XRP Ledger

Ripple extends decline to $0.52 on Thursday, wipes out weekly gains. Crypto expert asks Ripple CTO how the stablecoin will benefit the XRP Ledger and native token XRP.
After the US close, it’s the Tokyo CPI

After the US close, it’s the Tokyo CPI, a reliable indicator of the national number and then the BoJ policy announcement. Tokyo CPI ex food and energy in Japan was a rise to 2.90% in March from 2.50%.