
Bitcoin Prices Humbled By Resistance – BTC/USD Slips Below $17000.

Bitcoin Prices Slide From Psychological Resistance After a Temporary Retest of $17250
Bitcoin prices are trading in another big zone of technical support and resistance that has formed between Fibonacci levels from the 2017 – 2018 move. With the 23.6% retracement providing support around $15761, the 14.4% fib holds as resistance at $17283.
As the weekly chart below demonstrates the volatile price action that has contributed to both historic and recent moves, a bounce off $15479 has helped ease bearish momentum.
Bitcoin (BTC/USD) Weekly Chart
(Click on image to enlarge)
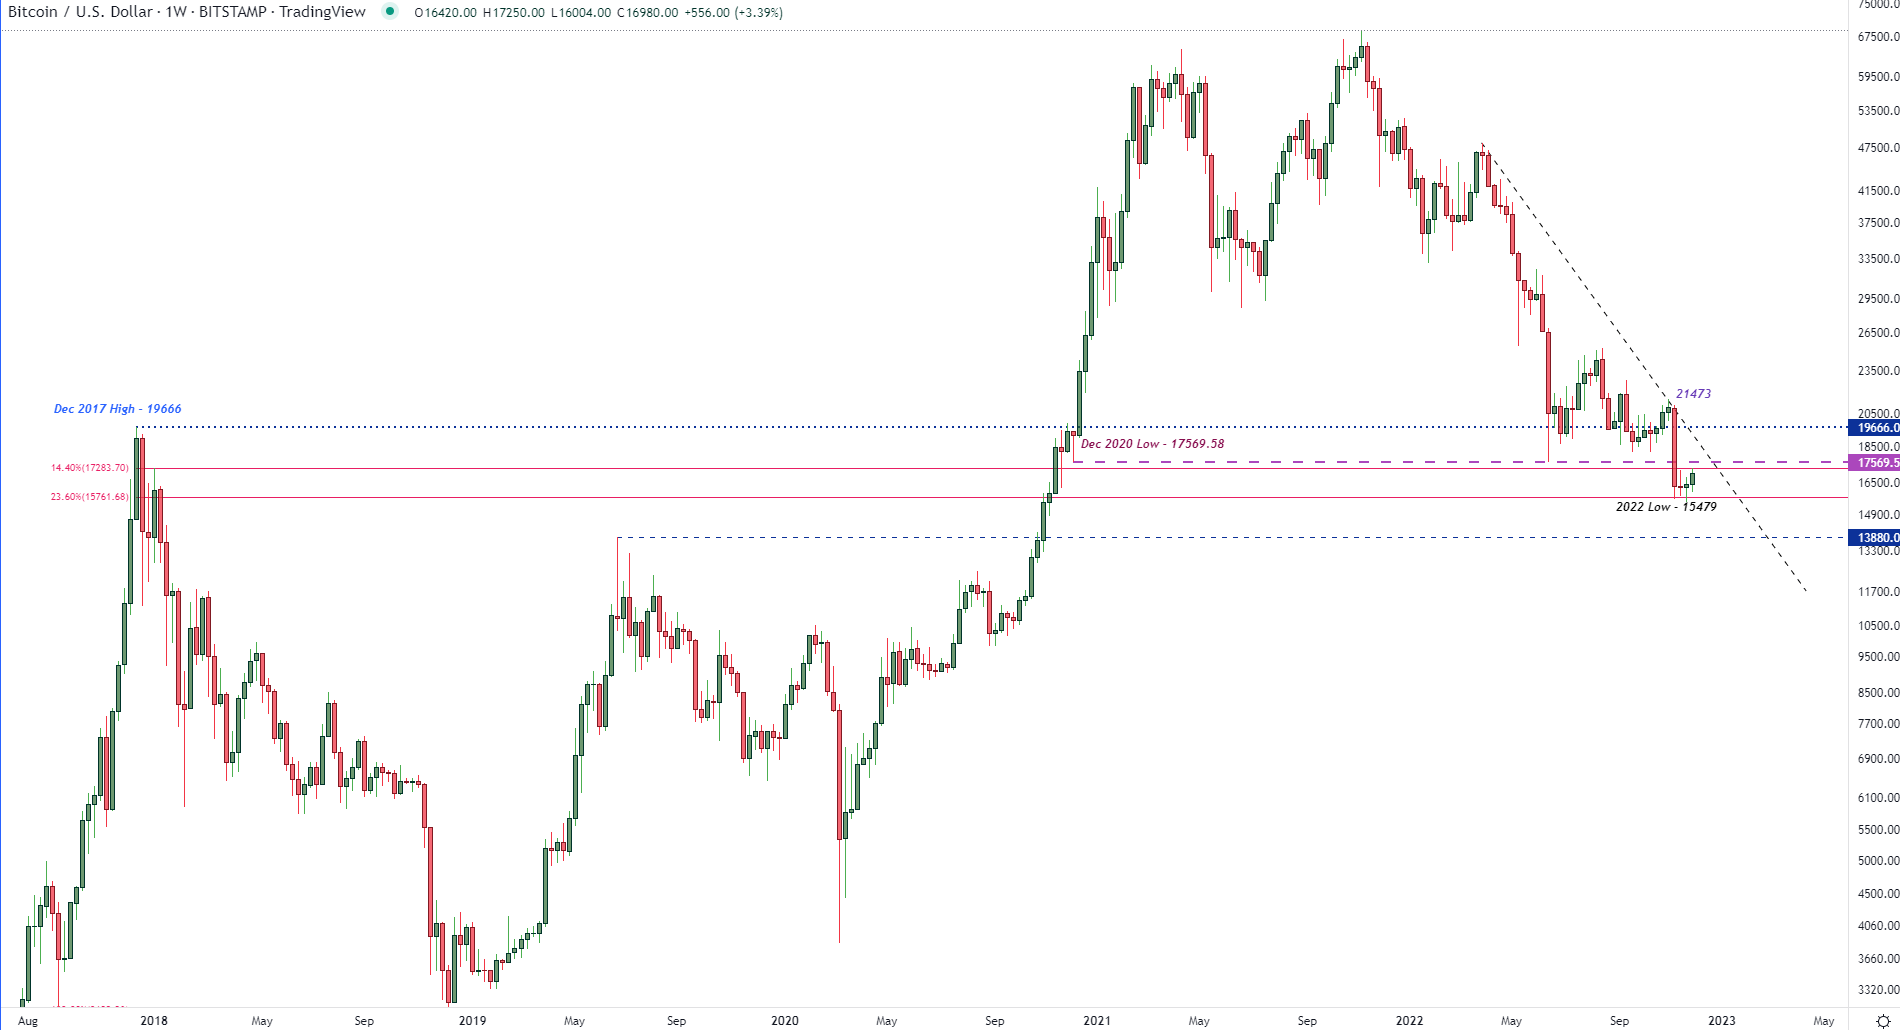
Chart prepared by Tammy Da Costa using TradingView
While BTC/USD looks to end the week on a positive note, a move above the 20-day MA (moving average) at $16540 has helped support slightly higher prices. As a series of doji candles represents indecision around this zone, a hold above the $17000 psychological handle is necessary to drive bullish momentum. As the current daily high rests at $17250, further upside could see the next barrier of resistance at the December 2020 low of $17569.58.
Bitcoin (BTC/USD) Daily Chart
(Click on image to enlarge)
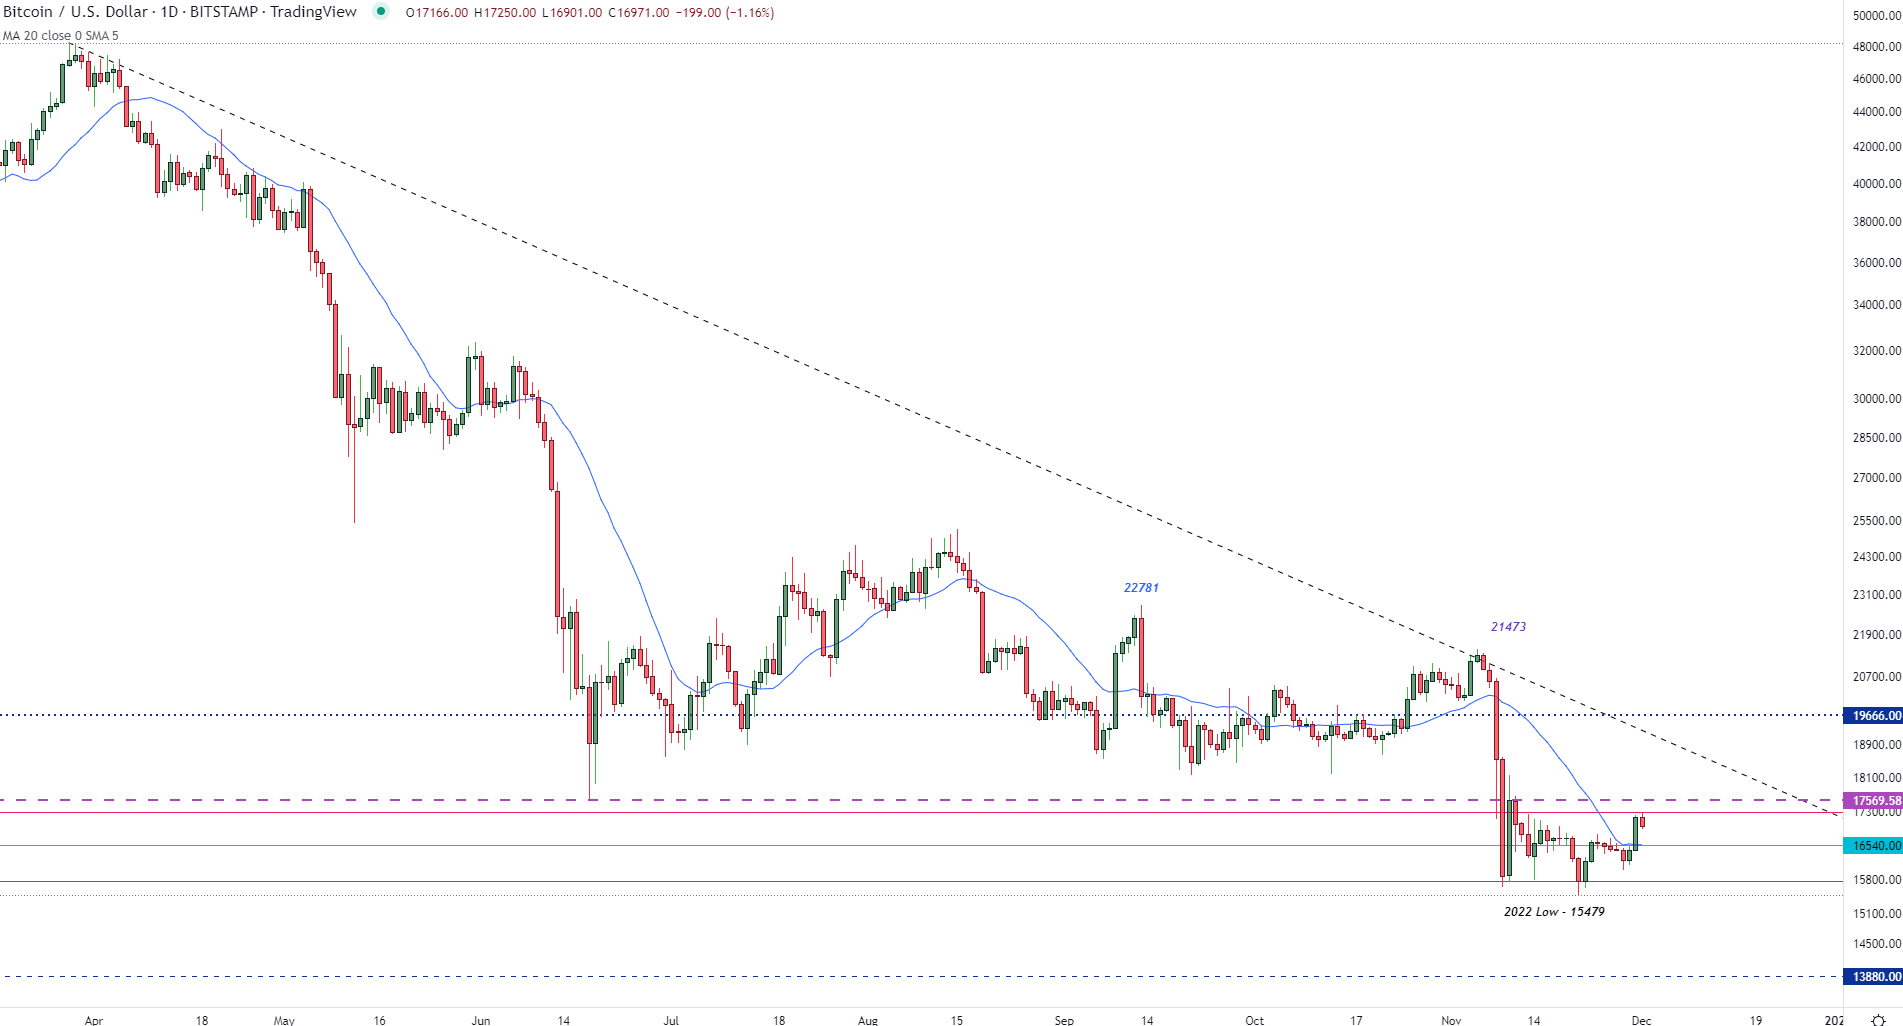
Chart prepared by Tammy Da Costa using TradingView
However, given the vulnerability of the industry to potential FTX contagion, a retest of $16000 and a move below $15479 could pave the way for bearish continuation potential towards the June 2019 high of $13880.
More By This Author:
Euro Dollar Outlook: EUR/USD Wrestles With Resistance At Prior SupportU.S. Equity Futures Supported By Earnings Despite Hawkish Fed
Bitcoin (BTC), Ethereum (ETH) Grind Lower As Grayscale Adds To Fears


