Published
1 year ago on
November 29, 2022
BTC/USD Orbiting 16484 Technicals: Sally Ho’s Technical Analysis – 30 November 2022
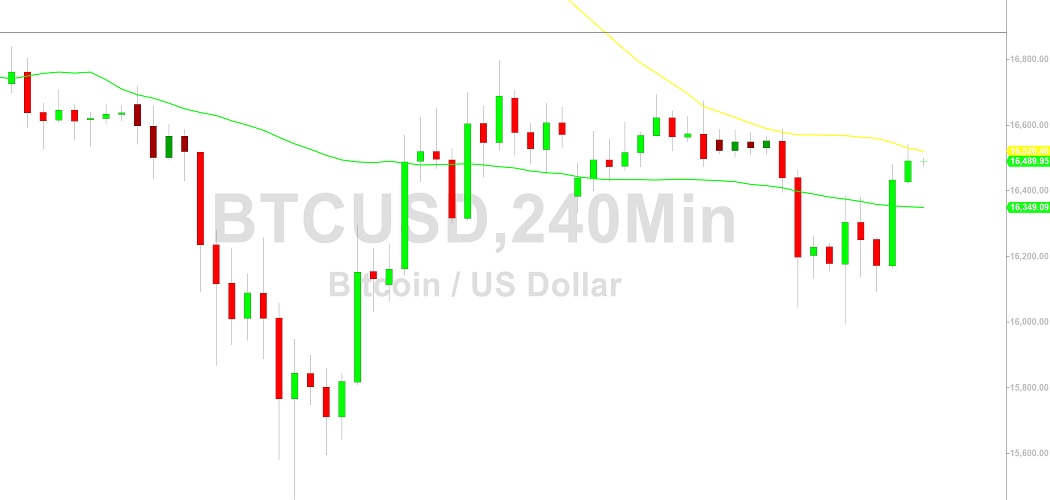
Bitcoin (BTC/USD) continued to orbit a key technical level early in the Asian session as the pair appreciated to the 16541.72 area before moderating, right around the 38.2% retracement of the depreciating range from 18140.62 to 15460. The technical significance of this range was confirmed when BTC/USD tested and bounced higher from the 16092.53 area, right around the 23.6% retracement of the same depreciating range. Prior to that upside move, BTC/USD encountered technical support around the 15992.64 area, representing a test of the 61.8% retracement of the recent appreciating range from 15460 to 16797.28. Renewed selling pressure risks a test of recent two-year lows around the 15460 level after Stops were elected below the 15512 area, a previous relative low that represented an exact bearish price objective based on selling pressure that strengthened around the 21478.80 and 18495.50 areas. Associated downside price objectives below current price activity include the 13369, 8837, and 7538 levels.
The recent depreciation intensified after Stops were elected below the 16990, 16966, and 16503 levels, areas associated with historical appreciating ranges that commenced around the 3858 and 9819 levels. Technicians continue to eye the 14500.15 and 10432.73 areas as major downside targets. Additional downside price objectives include the 14613, 10727, and 9682 levels, areas that are related to selling pressure that intensified around the 20894.96 and 18495.50 areas. Following the recent move lower to two-year lows, areas of potential technical resistance include the 17791, 18495, 19199, 20070, and 20201 levels. Traders are observing that the 50-bar MA (4-hourly) is bearishly indicating below the 100-bar MA (4-hourly) and below the 200-bar MA (4-hourly). Also, the 50-bar MA (hourly) is bearishly indicating below the 100-bar MA (hourly) and below the 200-bar MA (hourly).
Price activity is nearest the 100-bar MA (4-hourly) at 16520.41 and the 100-bar MA (Hourly) at 16438.71.
Technical Support is expected around 14500.15/ 13369.11/ 10727.75 with Stops expected below.
Technical Resistance is expected around 18495.40/ 19199.48/ 20070.64 with Stops expected above.
On 4-Hourly chart, SlowK is Bullishly above SlowD while MACD is Bullishly above MACDAverage.
On 60-minute chart, SlowK is Bullishly above SlowD while MACD is Bullishly above MACDAverage.
Disclaimer: Sally Ho’s Technical Analysis is provided by a third party, and for informational purposes only. It does not reflect the views of Crypto Daily, nor is it intended to be used as legal, tax, investment, or financial advice.
Investment DisclaimerStacks (STX) and Microstrategy (MSTR) are excellent bitcoin (BTC) leverage plays
Bitcoin bearish sentiment rules the market - buy more?