- GBP/USD has turned north and climbed above 1.2100.
- The pair approaches key resistance that aligns at around 1.2150.
- US Dollar could face additional selling pressure in case risk rally continues.
GBP/USD has preserved its bullish momentum early Thursday after having registered strong daily gains on Wednesday. The pair trades in positive territory above 1.2100 and remains on track to test the key resistance area that seems to have formed near 1.2150.
The broad-based selling pressure surrounding the US Dollar fueled GBP/USD rally mid-week. After FOMC Chairman Jerome Powell reaffirmed that smaller rate hikes could come as early as December, the CME Group FedWatch Tool's probability of a 50 basis points (bps) rate hike at the next policy meeting jumped to 80% from 66%.
Powell further added that they have made substantial progress toward a "sufficiently restrictive policy," further weighing on the USD. The benchmark 10-year US Treasury bond yield fell nearly 4% as a result and the US Dollar Index lost 1%. As of writing, the index was down 0.25% on the day at 105.60.
In the second half of the day, the Personal Consumption Expenditures (PCE) Price Index and the ISM Manufacturing PMI data from the US will be looked upon for fresh impetus.
The annual Core PCE Price Index is forecast to edge lower to 5% on a yearly basis in October from 5.1% in September. A reading below 5% is likely to cause the US Dollar to continue to weaken against its rivals. On the other hand, an unexpected increase in the Core PCE inflation figure could help the currency stay resilient against its rivals. Nevertheless, if Wall Street's main indexes continue to push higher regardless of the inflation report, GBP/USD is likely to continue to stretch higher.
The headline ISM PMI is expected to drop into the contraction territory below 50. The Prices Paid component of the survey is also projected to stay below 50 and reveal a further decline in input inflation in the manufacturing sector. The only scenario where the PMI report could trigger a US Dollar rebound would need to include both of these numbers arriving above 50.
GBP/USD Technical Analysis
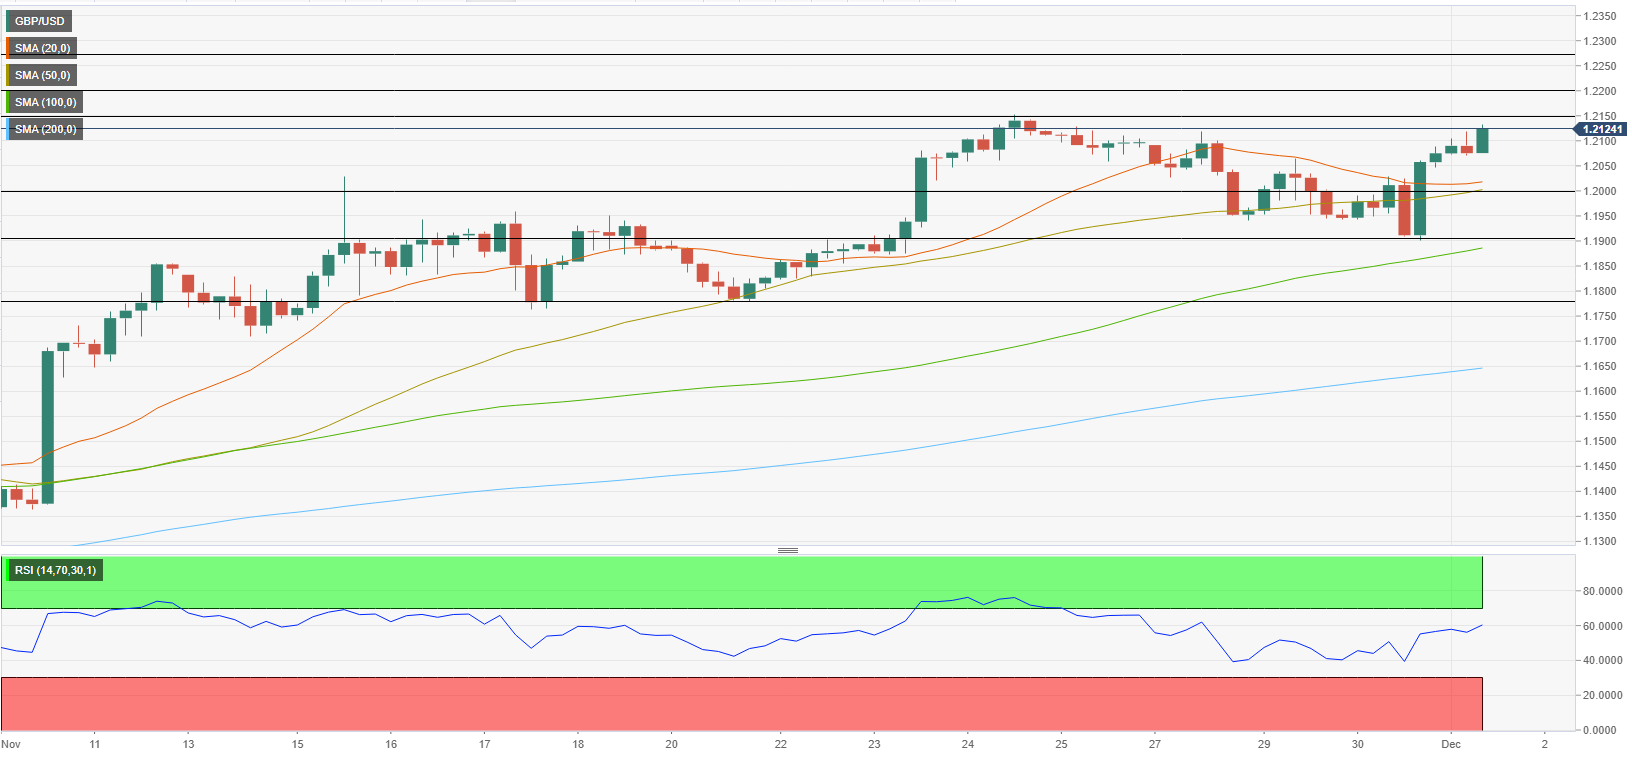
The Relative Strength Index (RSI) indicator on the four-hour chart rose to 60 in the European morning, pointing to a buildup of bullish momentum. The 200-day Simple Moving Average (SMA) forms significant resistance at 1.2150, where the multi-month high set on November 14 is also located. In case GBP/USD rises above that hurdle and starts using it as support, it could target 1.2200 (psychological level) and 1.2275 (August 10- high).
On the downside, 1.2100 (psychological level) aligns as interim support ahead of 1.2000 (psychological level, 50-period SMA on the four-hour chart).
Information on these pages contains forward-looking statements that involve risks and uncertainties. Markets and instruments profiled on this page are for informational purposes only and should not in any way come across as a recommendation to buy or sell in these assets. You should do your own thorough research before making any investment decisions. FXStreet does not in any way guarantee that this information is free from mistakes, errors, or material misstatements. It also does not guarantee that this information is of a timely nature. Investing in Open Markets involves a great deal of risk, including the loss of all or a portion of your investment, as well as emotional distress. All risks, losses and costs associated with investing, including total loss of principal, are your responsibility. The views and opinions expressed in this article are those of the authors and do not necessarily reflect the official policy or position of FXStreet nor its advertisers. The author will not be held responsible for information that is found at the end of links posted on this page.
If not otherwise explicitly mentioned in the body of the article, at the time of writing, the author has no position in any stock mentioned in this article and no business relationship with any company mentioned. The author has not received compensation for writing this article, other than from FXStreet.
FXStreet and the author do not provide personalized recommendations. The author makes no representations as to the accuracy, completeness, or suitability of this information. FXStreet and the author will not be liable for any errors, omissions or any losses, injuries or damages arising from this information and its display or use. Errors and omissions excepted.
The author and FXStreet are not registered investment advisors and nothing in this article is intended to be investment advice.
Recommended Content
Editors’ Picks
AUD/USD could extend the recovery to 0.6500 and above

The enhanced risk appetite and the weakening of the Greenback enabled AUD/USD to build on the promising start to the week and trade closer to the key barrier at 0.6500 the figure ahead of key inflation figures in Australia.
EUR/USD now refocuses on the 200-day SMA

EUR/USD extended its positive momentum and rose above the 1.0700 yardstick, driven by the intense PMI-led retracement in the US Dollar as well as a prevailing risk-friendly environment in the FX universe.
Gold struggles around $2,325 despite broad US Dollar’s weakness

Gold reversed its direction and rose to the $2,320 area, erasing a large portion of its daily losses in the process. The benchmark 10-year US Treasury bond yield stays in the red below 4.6% following the weak US PMI data and supports XAU/USD.
Bitcoin price makes run for previous cycle highs as Morgan Stanley pushes BTC ETF exposure

Bitcoin (BTC) price strength continues to grow, three days after the fourth halving. Optimism continues to abound in the market as Bitcoiners envision a reclamation of previous cycle highs.
US versus the Eurozone: Inflation divergence causes monetary desynchronization

Historically there is a very close correlation between changes in US Treasury yields and German Bund yields. This is relevant at the current juncture, considering that the recent hawkish twist in the tone of the Federal Reserve might continue to push US long-term interest rates higher and put upward pressure on bond yields in the Eurozone.