
Mapped: Global Energy Prices, By Country In 2022
For some countries, energy prices hit historic levels in 2022. Gasoline, electricity, and natural gas prices skyrocketed as Russia’s invasion of Ukraine ruptured global energy supply chains.
Households and businesses are facing higher energy bills amid extreme price volatility. Uncertainty surrounding the war looms large, and winter heating costs are projected to soar.
Given the global consequences of the energy crisis, the above infographic shows the price of energy for households by country, with data from GlobalPetrolPrices.com.
1. Global Energy Prices: Gasoline
Which countries and regions pay the most for a gallon of gas? Below are the top ten.

Source: GlobalPetrolPrices.com. As of October 31, 2022. Represents average household prices.
At an average $11.10 per gallon, households in Hong Kong pay the highest for gasoline in the world—more than double the global average. Both high gas taxes and steep land costs are primary factors behind high gas prices.
Like Hong Kong, the Central African Republic has high gas costs, at $8.60 per gallon. As a net importer of gasoline, the country has faced increased price pressures since the war in Ukraine.
Households in Iceland, Norway, and Denmark face the highest gasoline costs in Europe. Overall, Europe has seen inflation hit 10% in September, driven by the energy crisis.
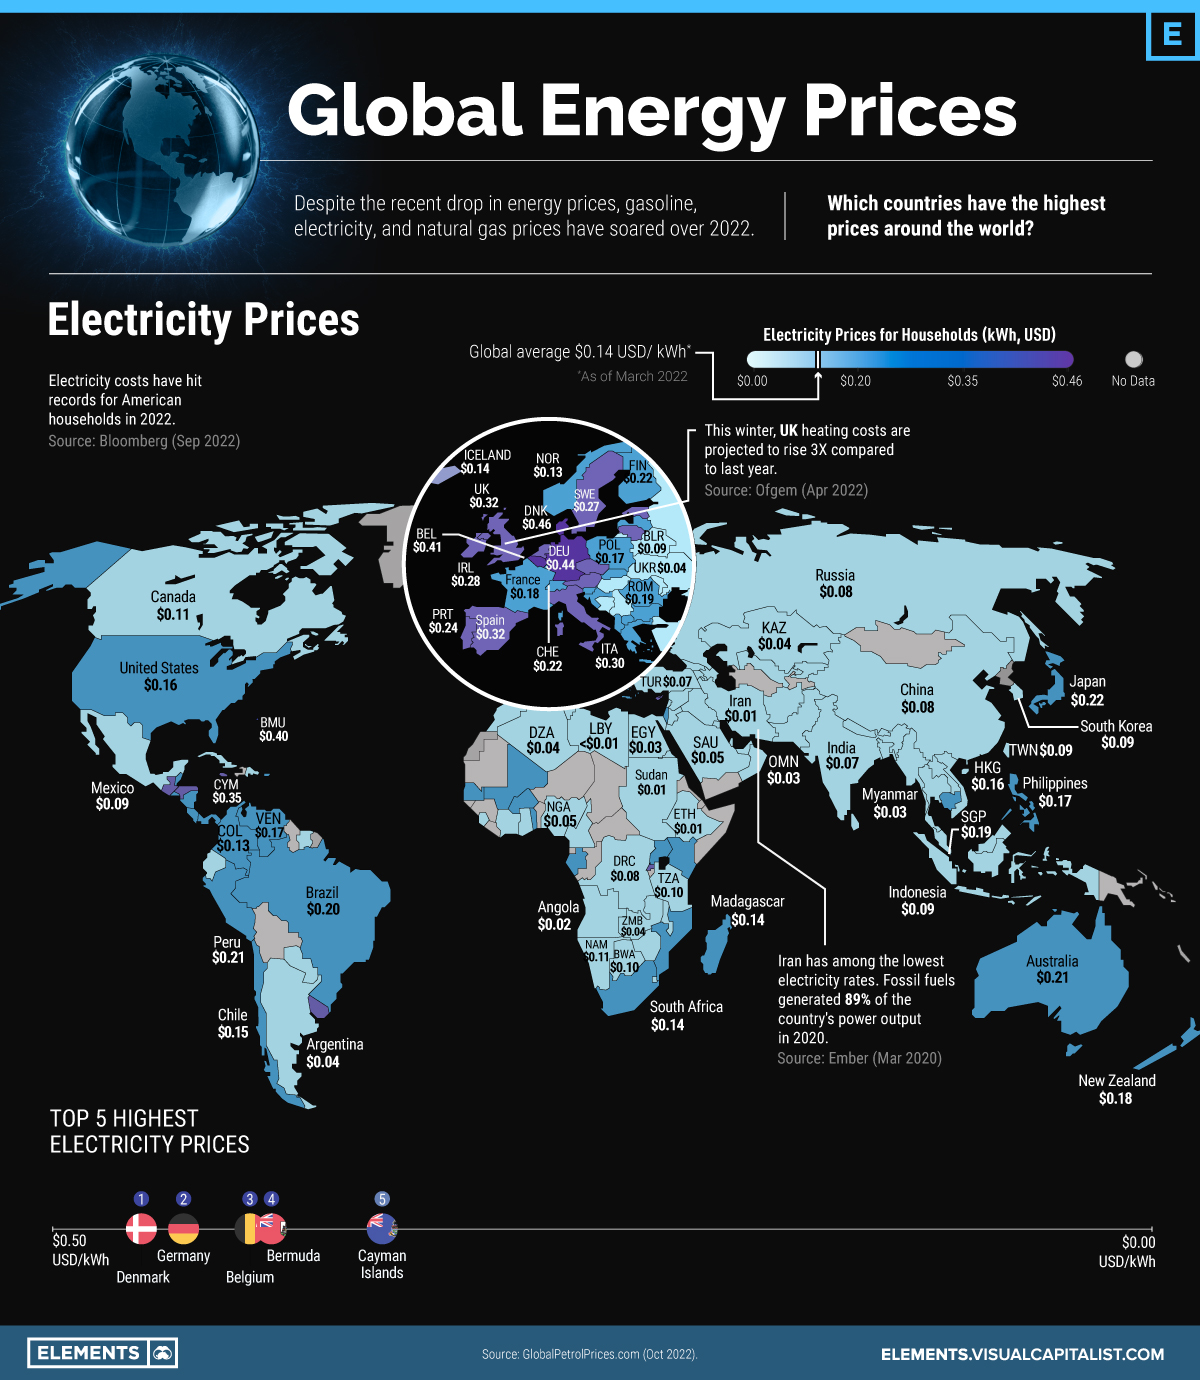
2. Global Energy Prices: Electricity
Extreme volatility is also being seen in electricity prices.
The majority of the highest household electricity prices are in Europe, where Denmark, Germany, and Belgium’s prices are about double that of France and Greece. For perspective, electricity prices in many countries in Europe are more than twice or three times the global average of $0.14 per kilowatt-hour.
Over the first quarter of 2022, household electricity prices in the European Union jumped 32% compared to the year before.

Source: GlobalPetrolPrices.com. As of March 31, 2022. Represents average household prices.
In the U.S., consumer electricity prices have increased nearly 16% annually compared to September last year, the highest increase in over four decades, fueling higher inflation.
However, households are more sheltered from the impact of Russian supply disruptions due to the U.S. being a net exporter of energy.
3. Global Energy Prices: Natural Gas
Eight of the 10 highest natural gas prices globally fall in Europe, with the Netherlands at the top. Overall, European natural gas prices have spiked sixfold in a year since the invasion of Ukraine.

Source: GlobalPetrolPrices.com. As of March 31, 2022. Represents average household prices.
The good news is that the fall season has been relatively warm, which has helped European natural gas demand drop 22% in October compared to last year. This helps reduce the risk of gas shortages transpiring later in the winter.
Outside of Europe, Brazil has the fourth highest natural gas prices globally, despite producing about half of supply domestically. High costs of cooking gas have been especially challenging for low-income families, which became a key political issue in the run-up to the presidential election in October.
Meanwhile, Singapore has the highest natural gas prices in Asia as the majority is imported via tankers or pipelines, leaving the country vulnerable to price shocks.
Increasing Competition
By December, all seaborne crude oil shipments from Russia to Europe will come to a halt, likely pushing up gasoline prices into the winter and 2023.
Concerningly, analysis from the EIA shows that European natural gas storage capacities could sink to 20% by February if Russia completely shuts off its supply and demand is not reduced.
As Europe seeks out alternatives to Russian energy, higher demand could increase global competition for fuel sources, driving up prices for energy in the coming months ahead.
Still, there is some room for optimism: the World Bank projects energy prices will decline 11% in 2023 after the 60% rise seen after the war in Ukraine in 2022.
More By This Author:
Ranked: The World’s Largest Copper ProducersAll Of The World’s Money And Markets In One Visualization
Charted: Income Distributions in 16 Different Countries
Disclosure: None.


