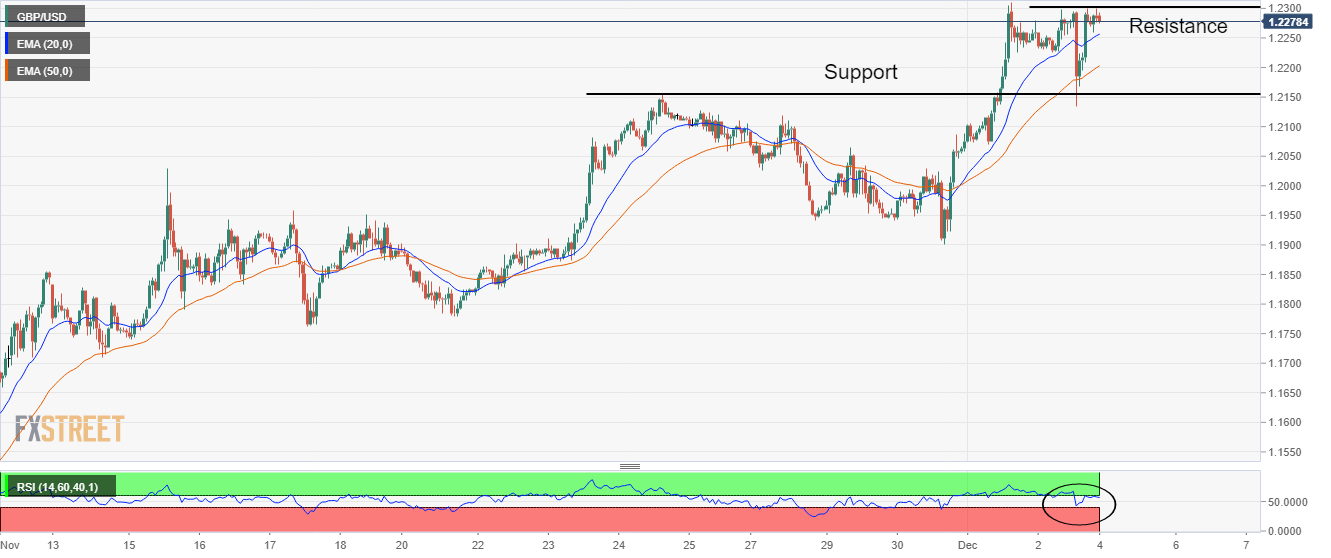
- The Cable is facing barricades while attempting to break above 1.2300.
- Advancing 20-and 50-EMAs signifies more upside ahead.
- A range shift by the RSI (14) into the 60.00-80.00 area will strengthen Pound Sterling.
The GBP/USD pair has witnessed marginal selling pressure after failing to cross the 1.2300 hurdle in the early Tokyo session. The Cable recovered sharply on Friday after a sheer correction to near 1.2150 on the release of robust United States Employment data.
Meanwhile, the risk impulse is extremely bullish as the Federal Reserve (Fed) is still looking to trim the interest rate hike pace. The US Dollar Index (DXY) is declining toward Friday’s low of around 104.40.
On an hourly scale, Cable witnessed a significant buying interest after dropping to near November 24 high of around 1.2150 on Friday. The recovery was full of strength and it pushed Cable near the critical resistance of 1.2300.
Advancing 20-and 50-period Exponential Moving Averages (EMAs) at 1.2260 and 1.2210 add to the upside filters.
Meanwhile, the Relative Strength Index (RSI) (14) has recovered after dropping to near 40.00. A break inside the bullish range of 60.00-80.00 would trigger a bullish momentum.
For further upside, a decisive break above Friday’s high at 1.2311 will drive Cable toward June 16 high at 1.2406, followed by the round-level resistance at 1.2500.
Alternatively, a decisive drop below Wednesday’s low at 1.1900 will drag the Cable toward November 22 low at 1.1825. A slippage below the latter will drag the pair to near November 21 low at 1.1779.
GBP/USD hourly chart
Information on these pages contains forward-looking statements that involve risks and uncertainties. Markets and instruments profiled on this page are for informational purposes only and should not in any way come across as a recommendation to buy or sell in these assets. You should do your own thorough research before making any investment decisions. FXStreet does not in any way guarantee that this information is free from mistakes, errors, or material misstatements. It also does not guarantee that this information is of a timely nature. Investing in Open Markets involves a great deal of risk, including the loss of all or a portion of your investment, as well as emotional distress. All risks, losses and costs associated with investing, including total loss of principal, are your responsibility. The views and opinions expressed in this article are those of the authors and do not necessarily reflect the official policy or position of FXStreet nor its advertisers. The author will not be held responsible for information that is found at the end of links posted on this page.
If not otherwise explicitly mentioned in the body of the article, at the time of writing, the author has no position in any stock mentioned in this article and no business relationship with any company mentioned. The author has not received compensation for writing this article, other than from FXStreet.
FXStreet and the author do not provide personalized recommendations. The author makes no representations as to the accuracy, completeness, or suitability of this information. FXStreet and the author will not be liable for any errors, omissions or any losses, injuries or damages arising from this information and its display or use. Errors and omissions excepted.
The author and FXStreet are not registered investment advisors and nothing in this article is intended to be investment advice.
Recommended content
Editors’ Picks
EUR/USD clings to daily gains above 1.0650

EUR/USD gained traction and turned positive on the day above 1.0650. The improvement seen in risk mood following the earlier flight to safety weighs on the US Dollar ahead of the weekend and helps the pair push higher.
GBP/USD recovers toward 1.2450 after UK Retail Sales data

GBP/USD reversed its direction and advanced to the 1.2450 area after touching a fresh multi-month low below 1.2400 in the Asian session. The positive shift seen in risk mood on easing fears over a deepening Iran-Israel conflict supports the pair.
Gold holds steady at around $2,380 following earlier spike

Gold stabilized near $2,380 after spiking above $2,400 with the immediate reaction to reports of Israel striking Iran. Meanwhile, the pullback seen in the US Treasury bond yields helps XAU/USD hold its ground.
Bitcoin Weekly Forecast: BTC post-halving rally could be partially priced in Premium

Bitcoin price shows no signs of directional bias while it holds above $60,000. The fourth BTC halving is partially priced in, according to Deutsche Bank’s research.
Week ahead – US GDP and BoJ decision on top of next week’s agenda

US GDP, core PCE and PMIs the next tests for the Dollar. Investors await BoJ for guidance about next rate hike. EU and UK PMIs, as well as Australian CPIs also on tap.