Published
1 year ago on
December 05, 2022
BTC/USD Near Multi-Week Highs: Sally Ho’s Technical Analysis – 6 December 2022
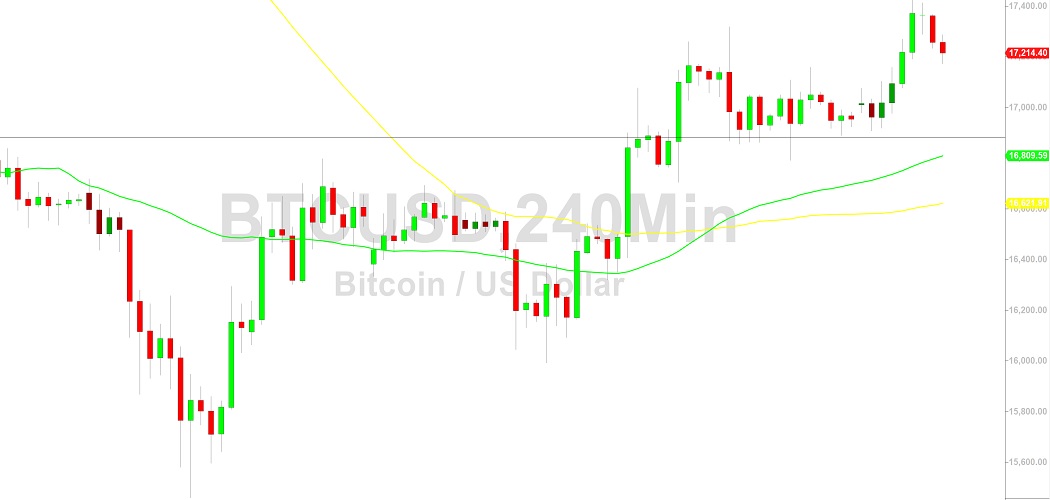
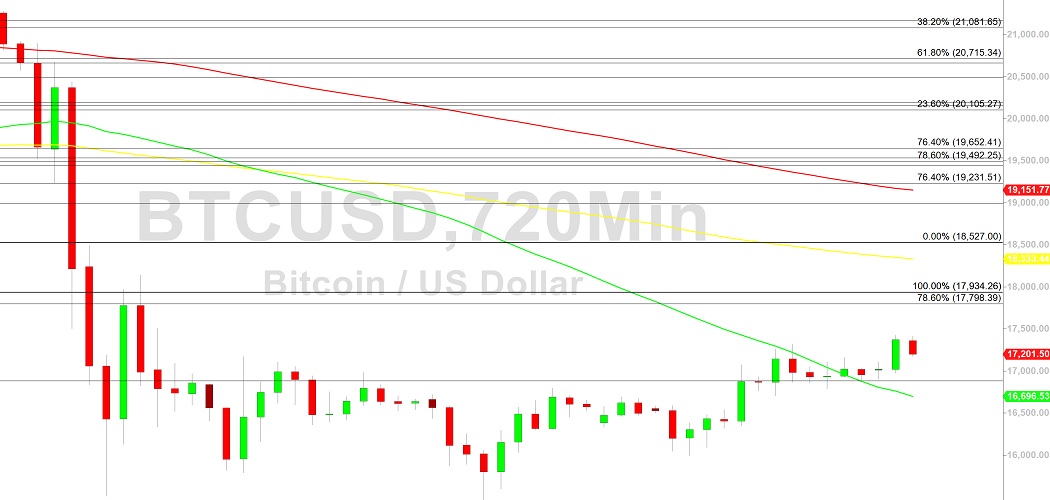
Bitcoin (BTC/USD) remained near multi-week highs early in the Asian session as the pair traded as high as the 17424.59 level after buying pressure intensified around the 16907 area, representing another test of the 23.6% retracement of the appreciating range from 15460 to 17317.80. If BTC/USD is able to extend its upward trajectory, upside areas of potential technical resistance and selling pressure including the 17791, 18495, 19199, 20070, and 20201 levels. If recent upside momentum reverses, traders may test recent two-year lows around the 15460 level established after Stops were elected below the 15512 area, a previous relative low that represented an exact bearish price objective based on selling pressure that strengthened around the 21478.80 and 18495.50 areas.
Following the recent appreciation from 15992.64, technical support and buying pressure are possible around the 16811, 16655, 16498, 16305, and 16276 levels. Associated downside price objectives below current price activity include the 13369, 8837, and 7538 levels. Technicians continue to eye the 14500.15 and 10432.73 areas as major downside targets, and additional downside price objectives include the 14613, 10727, and 9682 levels, areas that are related to selling pressure that intensified around the 20894.96 and 18495.50 areas. Traders are observing that the 50-bar MA (4-hourly) is bearishly indicating below the 200-bar MA (4-hourly) and above the 100-bar MA (4-hourly). Also, the 50-bar MA (hourly) is bullishly indicating above the 100-bar MA (hourly) and above the 200-bar MA (hourly).
Price activity is nearest the 50-bar MA (4-hourly) at 16809.21 and the 50-bar MA (Hourly) at 17091.43.
Technical Support is expected around 14500.15/ 13369.11/ 10727.75 with Stops expected below.
Technical Resistance is expected around 18495.40/ 19199.48/ 20070.64 with Stops expected above.
On 4-Hourly chart, SlowK is Bearishly below SlowD while MACD is Bullishly above MACDAverage.
On 60-minute chart, SlowK is Bearishly below SlowD while MACD is Bearishly below MACDAverage.
Disclaimer: Sally Ho’s Technical Analysis is provided by a third party, and for informational purposes only. It does not reflect the views of Crypto Daily, nor is it intended to be used as legal, tax, investment, or financial advice.
Investment DisclaimerBitcoin upcoming monthly close will be crucial
Bitcoin suffering down week - macro picture uncertain