
Exciting Times: It's All About Gold
The 2021-2025 war cycle is currently in a lull and oil is likely to determine what happens in 2023.
(Click on image to enlarge)
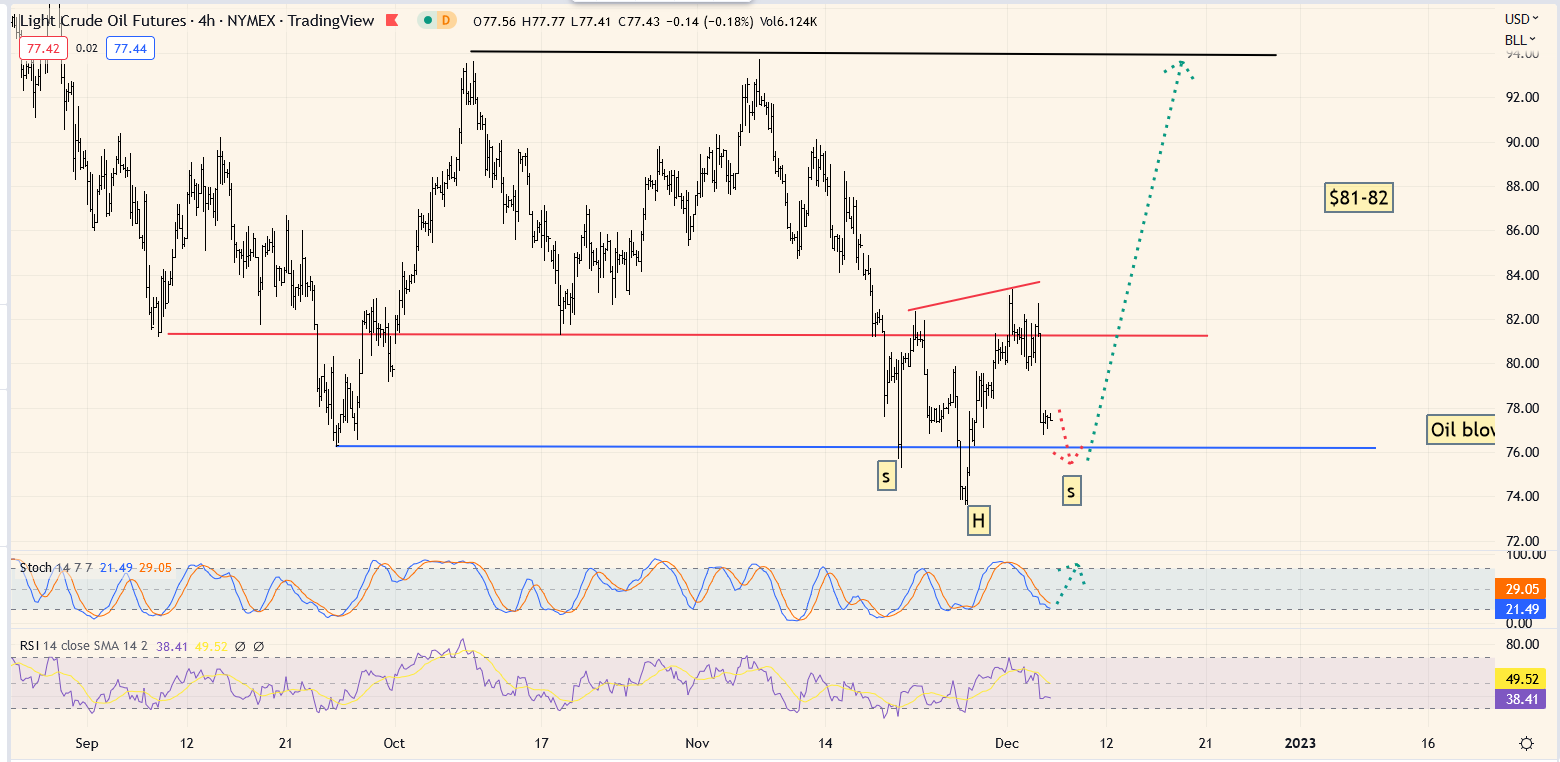
Daily oil price chart.
An aesthetic right shoulder is forming now, and the target is about $94.
Central bankers told citizens of the world that inflation would be transitory (wrong)…
Now they claim that a few tiny rate hikes from the zero zone will fix the problem. Sadly, inflation can’t be fixed with these tiny rate hikes because it is caused by out-of-control government debt and spending, and by the macabre sanctions that are creating “here-to-stay” inflation in Europe.
The US government’s meddling in Taiwan (while leaving 10 million blockaded Cubans to rot in America’s backyard) could create a new and much bigger wave of inflation when this meddling scheme inevitably goes awry. The bottom war cycle line:
Exciting times lie ahead… and it’s all about gold!
(Click on image to enlarge)
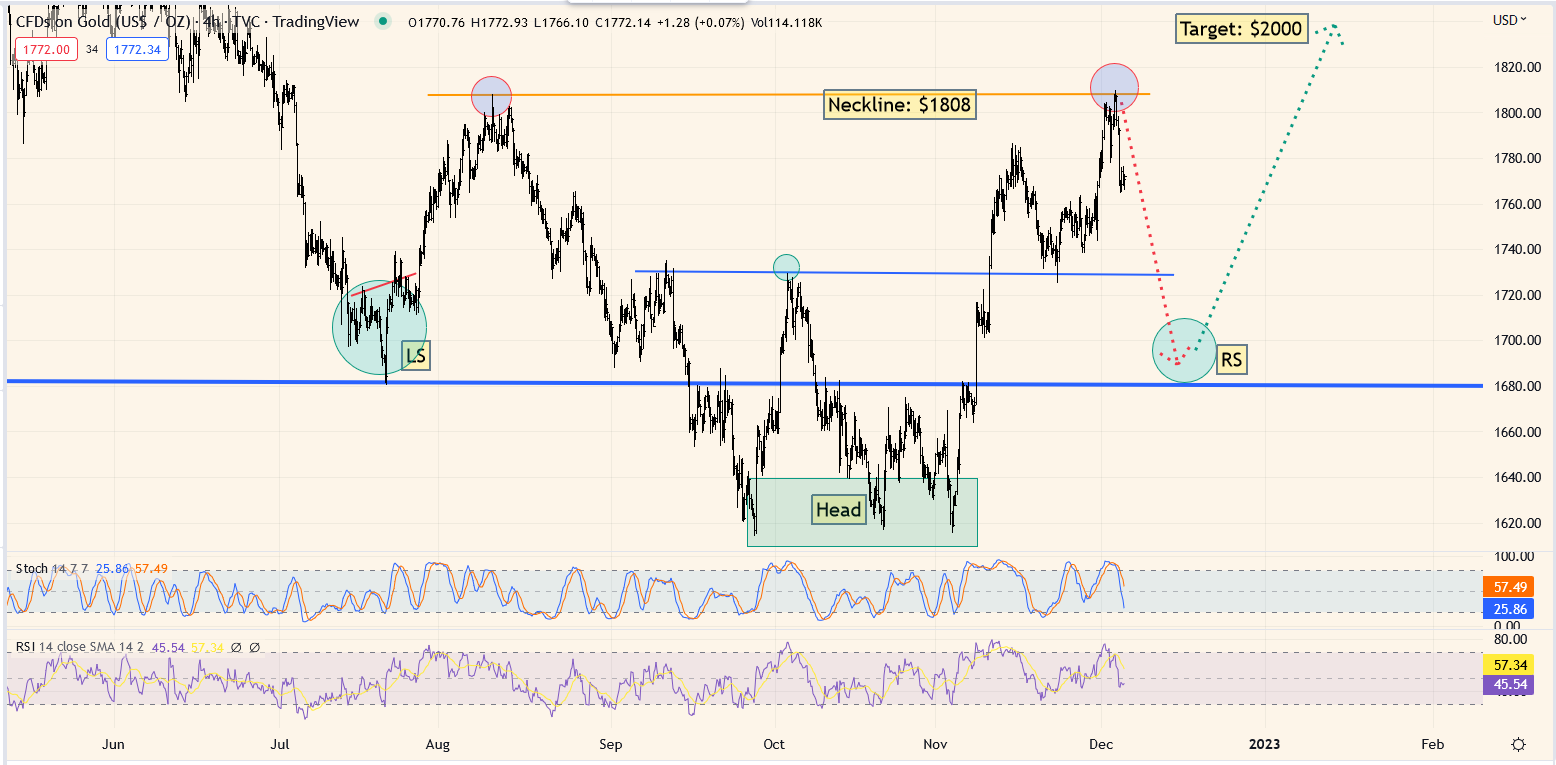
I urged over-allocated gold stock enthusiasts to trim positions on the rally into the neckline, and many did.
The war cycle is big, but the empire transition cycle is vastly bigger, so it’s important that all gold market investors are properly positioned to manage their personal greed on rallies and fear on dips. If an investor isn’t really comfortable, they are unlikely to fare well.
For another look at the gold chart:
(Click on image to enlarge)
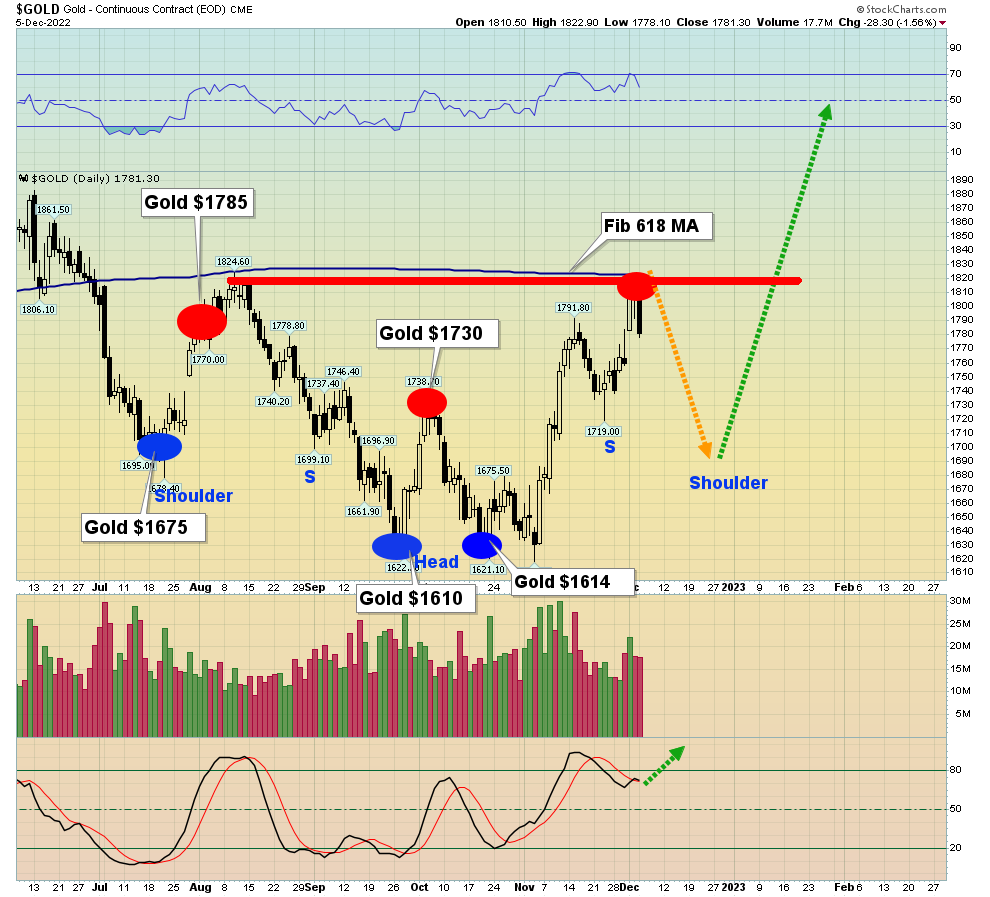
This futures market chart looks like Michelangelo carved it out of marble! Note the incredible action of the Fibonacci 618 moving average; it essentially defines the neckline of a majestic inverse H&S pattern.
The price doesn’t need to decline to $1700-$1680 to complete the right shoulder, but if it happens, the chart quickly becomes even more aesthetic (and bullish) than it already is.
What about stock and crypto markets?
(Click on image to enlarge)
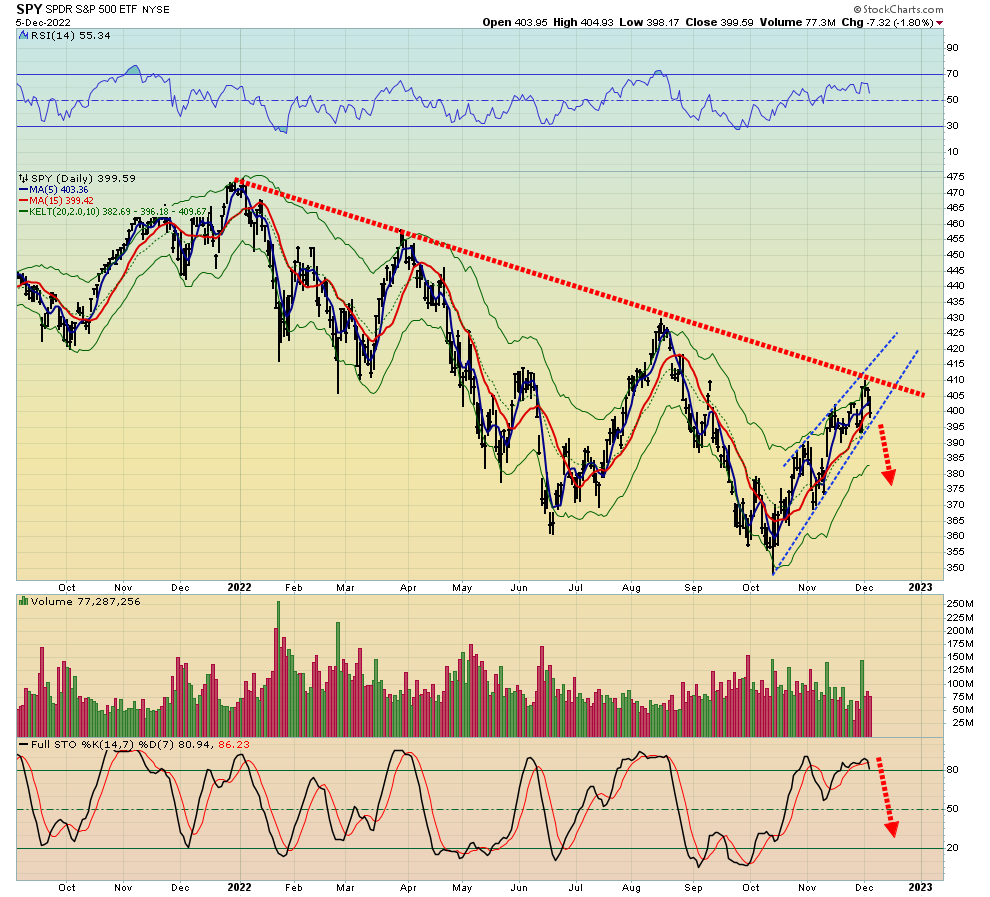
SPY ETF chart.
It could break out of the downtrend (temporarily) if enough investors convince themselves that the Fed will again act as their personal soup kitchen… but it’s a horrific chart.
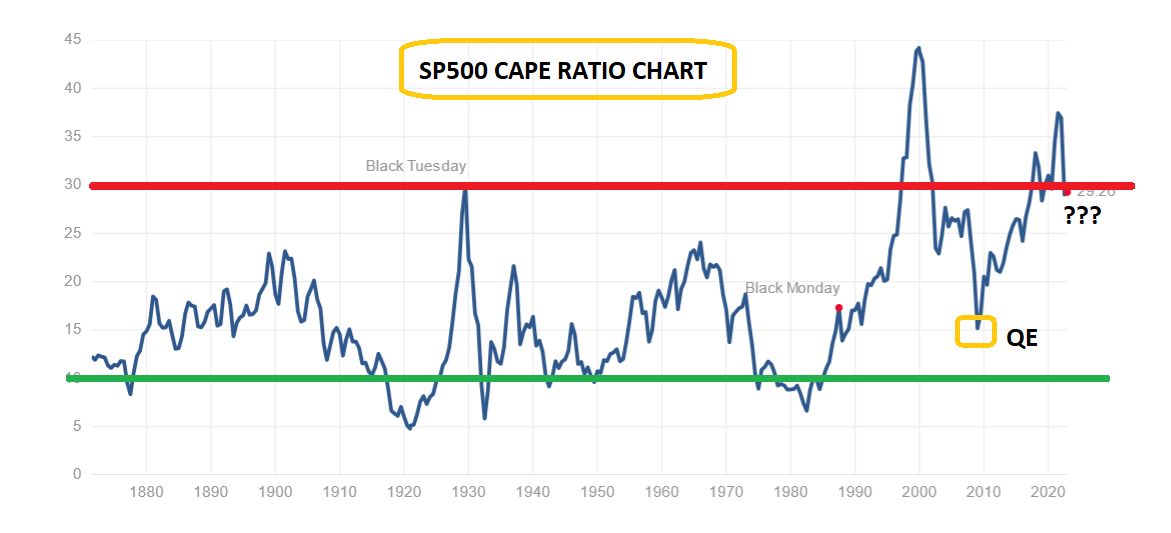
Even if the Fed does play “Soup Kitchen 2.0”, I have no interest in seeing investors buying the S&P500 with any size, let alone the Nasdaq… not with the CAPE ratio at 29.
The value zone for the CAPE ratio is 10 and lower. The market bottomed at CAPE 15 in 2008, but only because of the enormous (and hideous) QE program launched by Ben Bernanke. Depressed stock market investors who think a buying opportunity like October 2008 is about to happen again, with the CAPE up in the clouds at 29… are likely in for a nasty surprise.
What’s more likely to happen is a brief lull in the Fed’s hiking program in 2023, then US government meddling in Taiwan goes “off the rails” in 2024, and new and much bigger waves of inflation crash into the shores of America, featuring oil roaring to $130, $170, and $200.
Crypto looks better than the stock market. On that note:
(Click on image to enlarge)
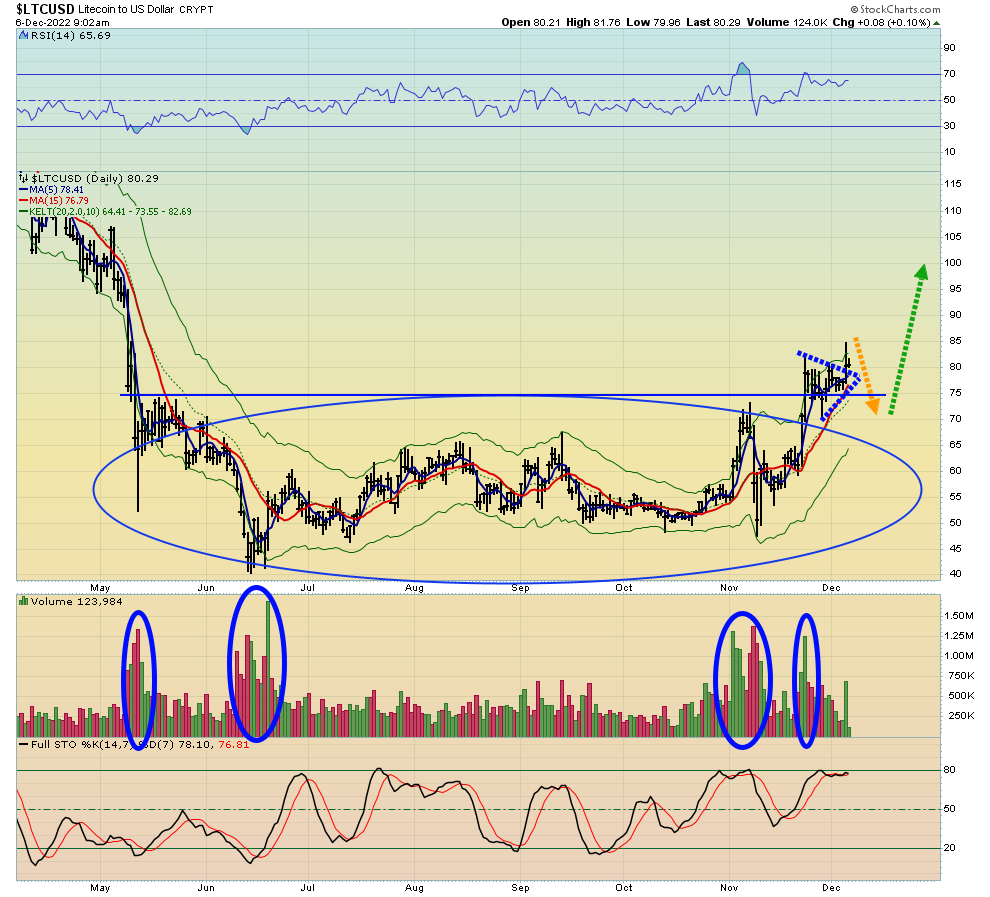
As a rule of thumb, Litecoin tends to act like silver, meaning it tends to indicate major changes in trends for bitcoin and the entire crypto market. I bought at $7, sold into $100, and more into the blowoff highs of $250-$400. I’ve been a modest accumulator in the current base pattern (gulag?).
The bottom line: Crypto has been dragged out of the private money “palace” (where gold is Queen), thrust into the stock market world, and paid the price. As the war cycle intensifies, crypto may resurrect itself as legitimate private money while the US stock market is annihilated.
I will note that Bitcoin was about flat in price action yesterday, while the stock market was smashed. Having said that, Bitcoin is not gold and Litecoin is not silver, so allocation to the sector should be modest.
To view a key silver chart:
(Click on image to enlarge)
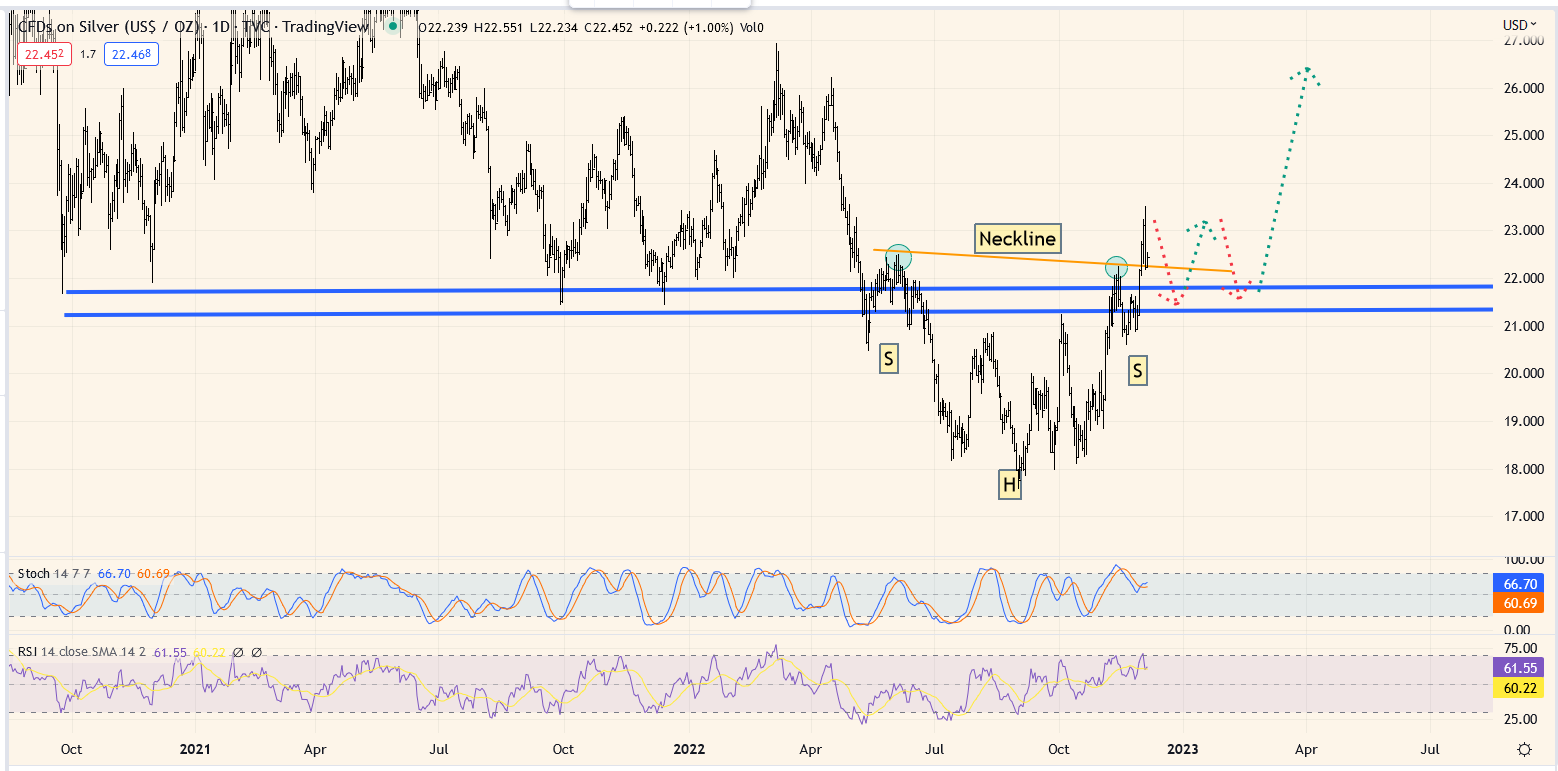
Silver has already surged above the inverse H&S pattern neckline, while gold has stalled there. That’s a bullish sign… for both gold and silver.
Two big reports on the US side of the “price discovery pond” could keep silver range bound for the next week or so; first is the Dec 13 CPI (inflation) report, and then a key Fed announcement on rates comes the following day.
I urged Western gold bugs to focus more on the real economy Chinese lockdowns pivot than a Fed soup kitchen pivot, and on cue, the Chinese stock market has rocketed higher. Most gold bugs have little interest in buying the Chinese stock market, but they should be aware that a rising stock market there creates enormous celebratory buying of gold. It could be a very golden Chinese New Year if the current lockdowns pivot continues, and I’m projecting it will.
The miners?
(Click on image to enlarge)
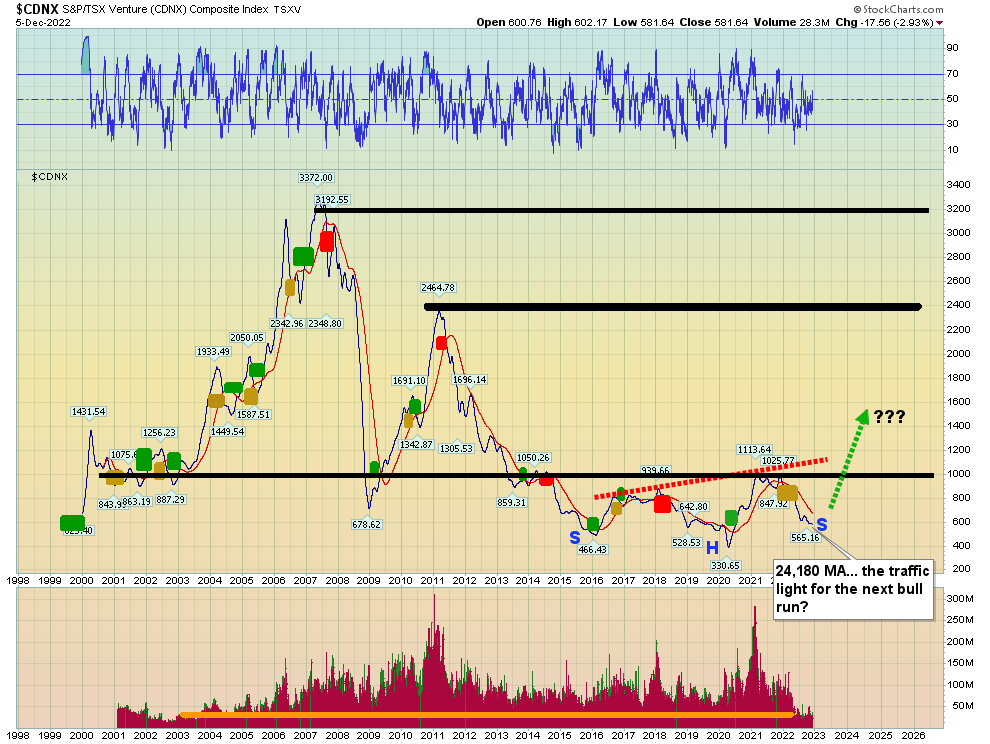
I’ve urged junior mine stock investors to be patient while the 24, 180 series moving averages remain on a sell for the CDNX. The good news is that a crossover buy signal looks as imminent as a rally from the current inverse H&S pattern’s right shoulder low!
I’m also seeing a vast array of enormous spikes in volume… on literally dozens of CDNX-listed miners.
For a solid look at the senior mining stocks:
(Click on image to enlarge)
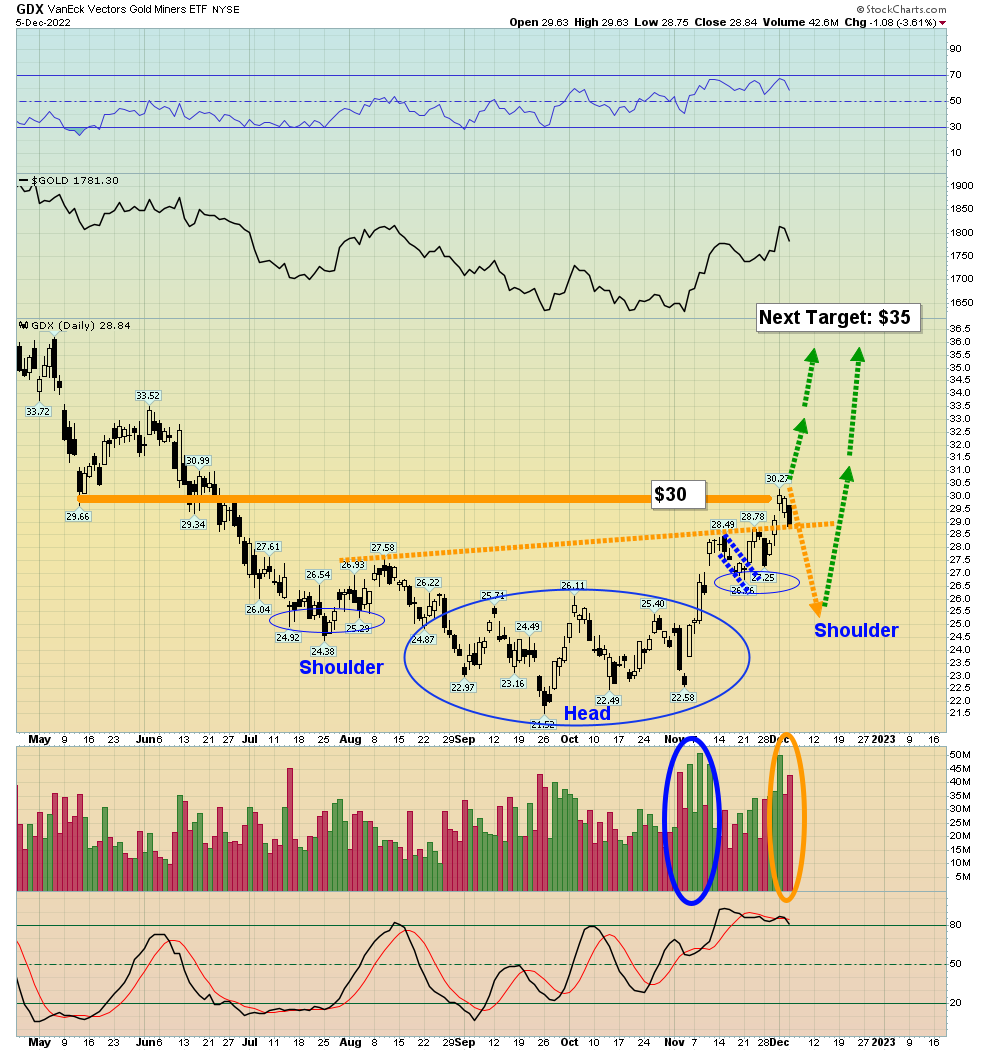
enticing GDX chart.
While the rally could see GDX burst through the $30 ($1808 for gold) resistance zone right now, that’s unlikely.
What’s more likely is a drift lower ahead of the CPI report and Fed announcement… a drift that gold bugs around the world need to buy. Then all that’s needed is to sit back and watch the gold stocks fly!
More By This Author:
Gold Stocks & Gold A Bullish Divergence
Gold & Oil: Another Inflationary Wave?
Gold Charts: A Bullish Shine


