
Bitcoin Falling Wedge, Ethereum Triangle: Continued Consolidation

Crypto markets remain remarkably quiet. While Bitcoin broke support at a key spot on the chart after the FTX fiasco began to make its way into the headlines, price has been relatively calm ever since, particularly over the past few weeks. Two consecutive dojis on the weekly chart led to a mild bounce this week but, all in all, volatility remains pretty low on a short-term basis as price action continues to show consolidation.
Bitcoin Weekly Price Chart
(Click on image to enlarge)
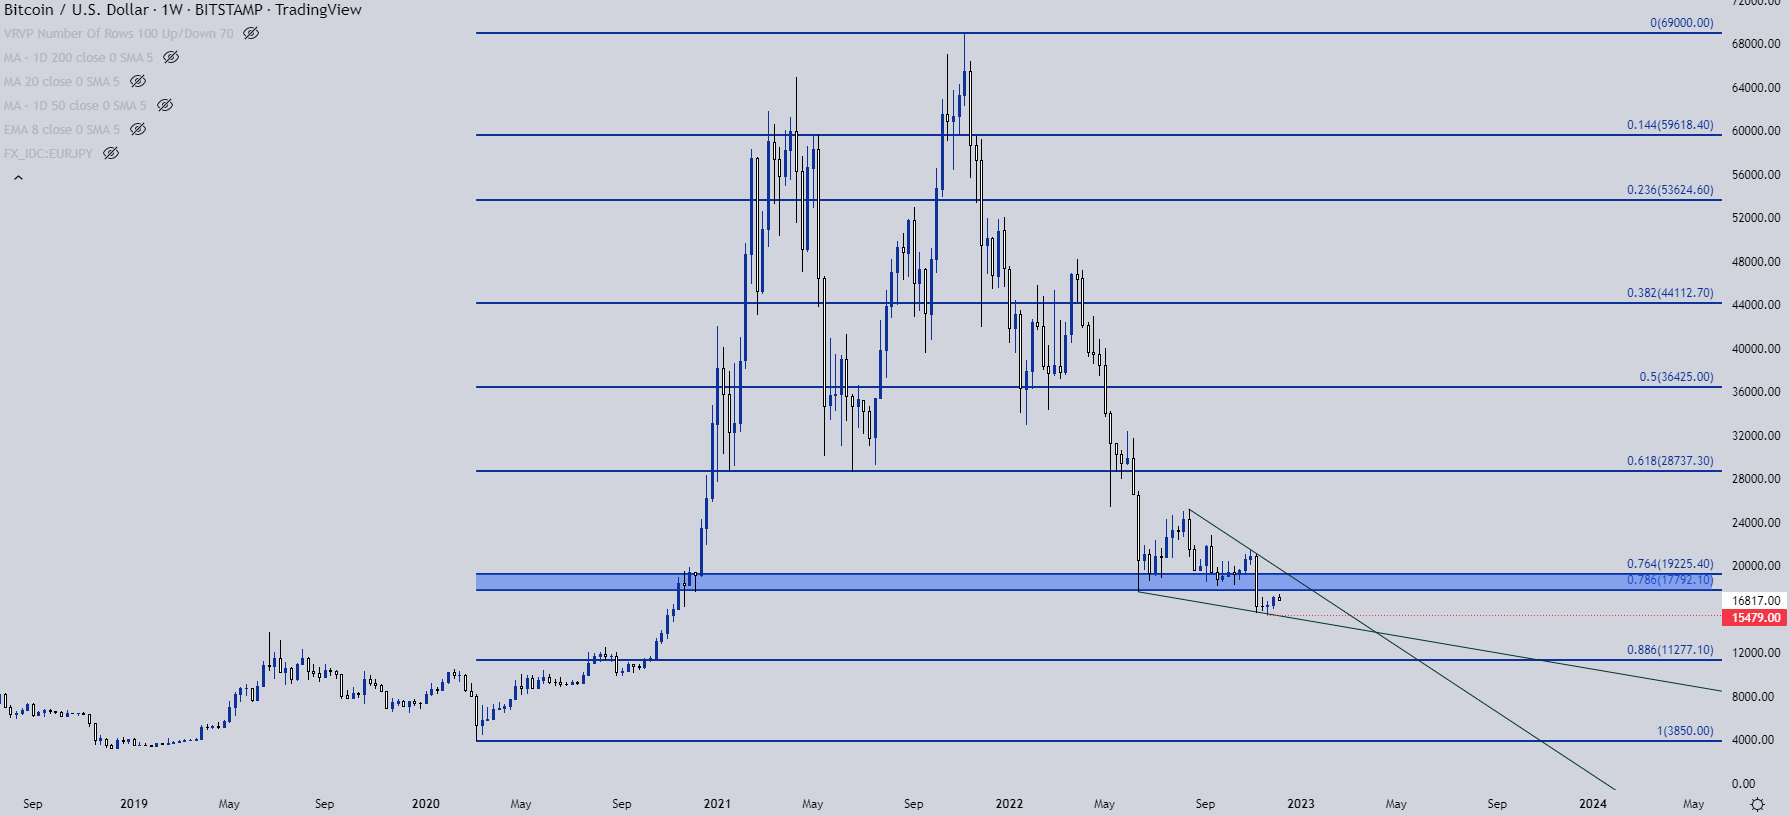
Chart prepared by James Stanley; Bitcoin on Tradingview
From the daily chart below, we can get greater visibility around that recent lack of trend. In early-November, as price was breaking down below support, a low came in around $15,632. Sellers took another swing later in November, breaching that prior low albeit barely, and that helps to establish a trendline at support when being spanned back to the June low.
This trendline, when matched with the pace of lower-highs, can be construed as a falling wedge formation. Such formations are often approached with the aim of bullish reversals, largely on the basis of support being in-play, which is restraining bears from pushing to deeper lower-lows even as the aggressively press at highs or resistance.
Since that failed breakdown we have not seen any lower-lows; and a higher-high has just printed on the daily chart after Monday’s push up to 17,418. The big question now is whether bulls can or will support the move, and for that, we’ll need to see a higher-low above the 16k psychological level to keep the door open for bullish continuation scenarios on a short-term basis.
Bitcoin Daily Price Chart
(Click on image to enlarge)
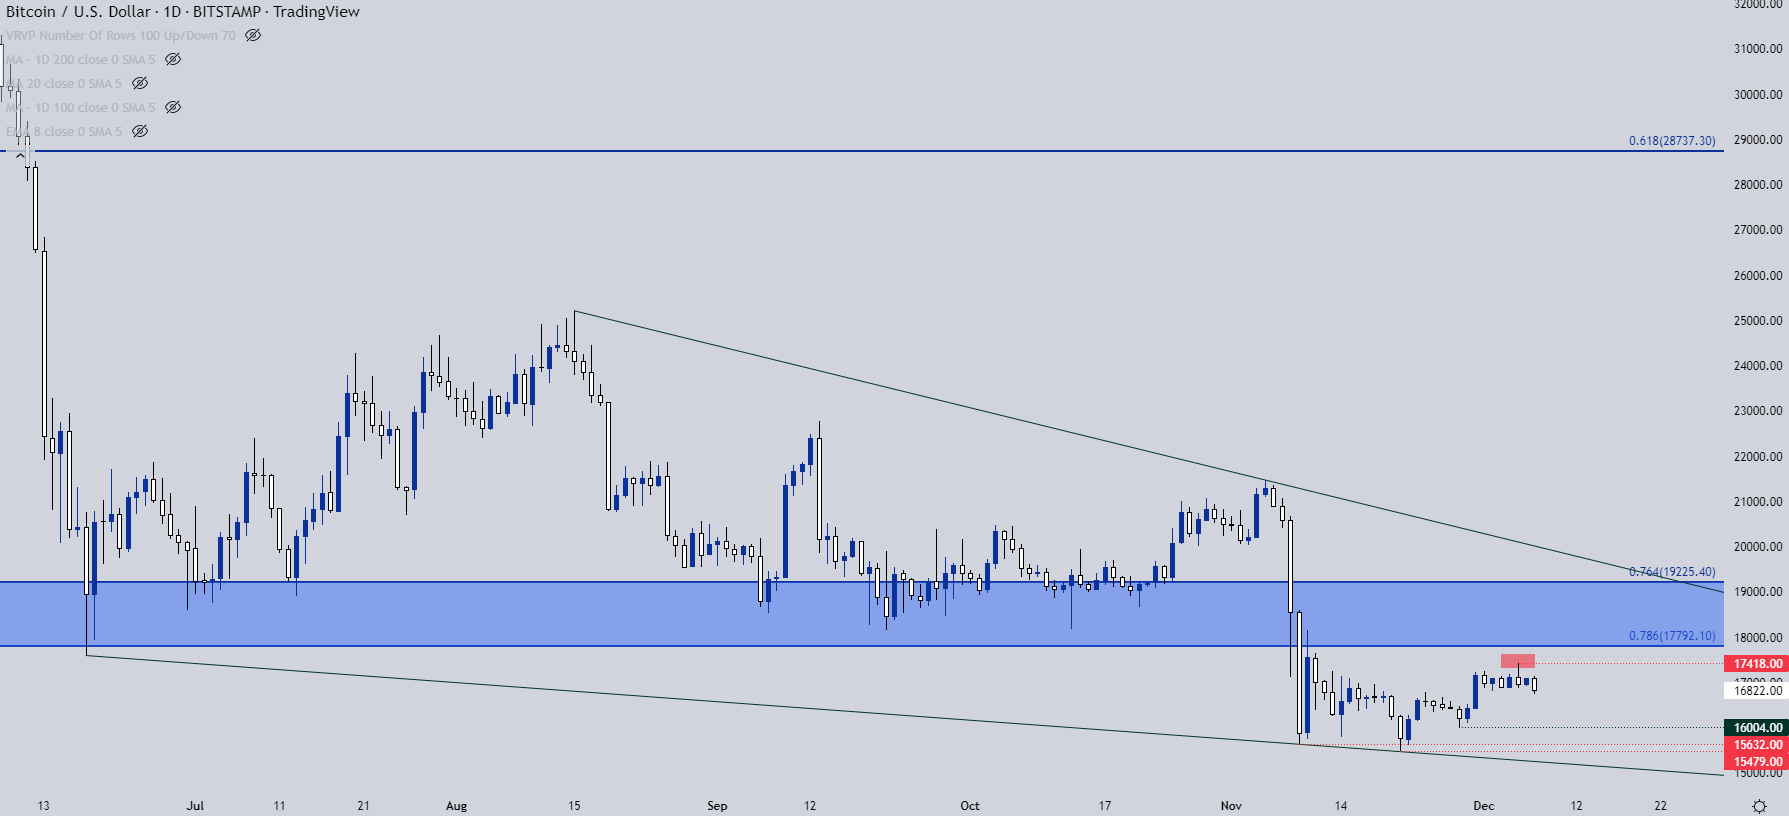
Chart prepared by James Stanley; Bitcoin on Tradingview
ETHEREUM
A similar scenario has showed in Ethereum but, notably, the June low remains unfettered. There was a sell-off in early-November as the headlines were hitting but, price remained above the $1k handle. Regarding consolidation, while Bitcoin is showing the falling wedge in the above chart, Ethereum has been tightening into a symmetrical triangle which carries less of a directional bias, in and of itself, but similarly shows an equalization of price action after a large move.
Ethereum Weekly Chart
(Click on image to enlarge)
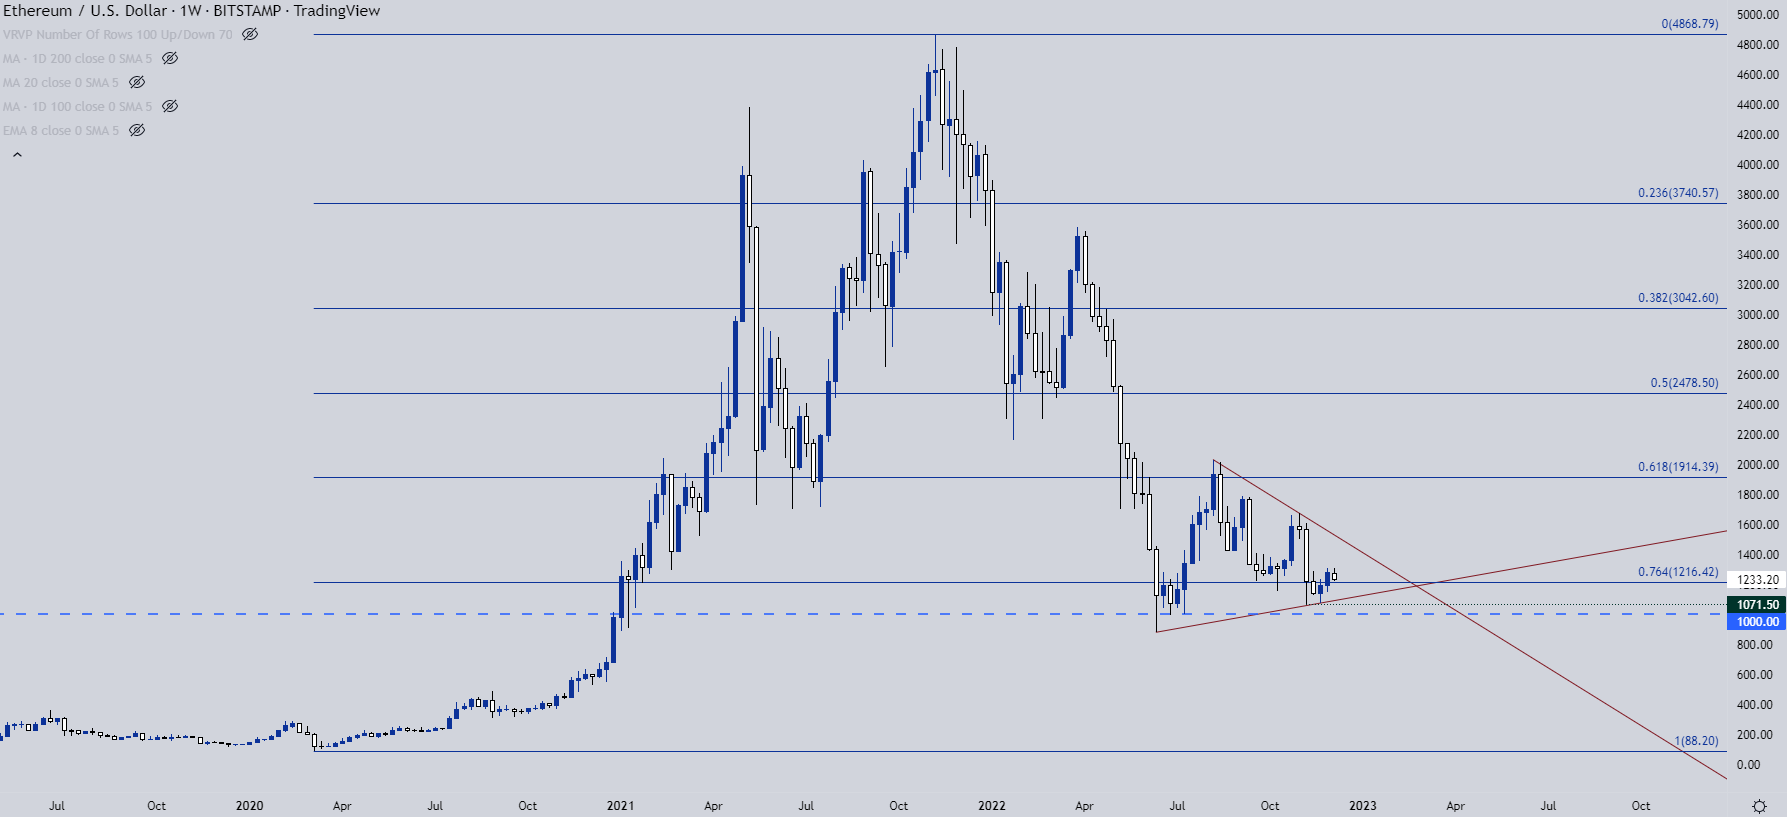
Chart prepared by James Stanley; Ethereum on Tradingview
On a shorter-term basis, that early-November low at $1,071 was respected a couple of weeks later when sellers tested the low again. That second iteration showed a slightly higher-low, printing at $1,074.
That higher-low test in late-November led to a re-test of a Fibonacci level at $1,216 which was broken-through a week later. At this point, that level highlights support potential, and provided that bulls hold the low above the prior higher-low at $1,150, the door can remain open for bullish continuation. Follow-through resistance potential exists at the prior higher-high of $1,300, after which the $1,350 level comes into play. Longer-term, it’s the $1,500 level that looms large and this is confluent with the resistance trendline from the symmetrical triangle as of around the middle of this month, which is also around the FOMC rate decision.
Ethereum Daily Price Chart
(Click on image to enlarge)
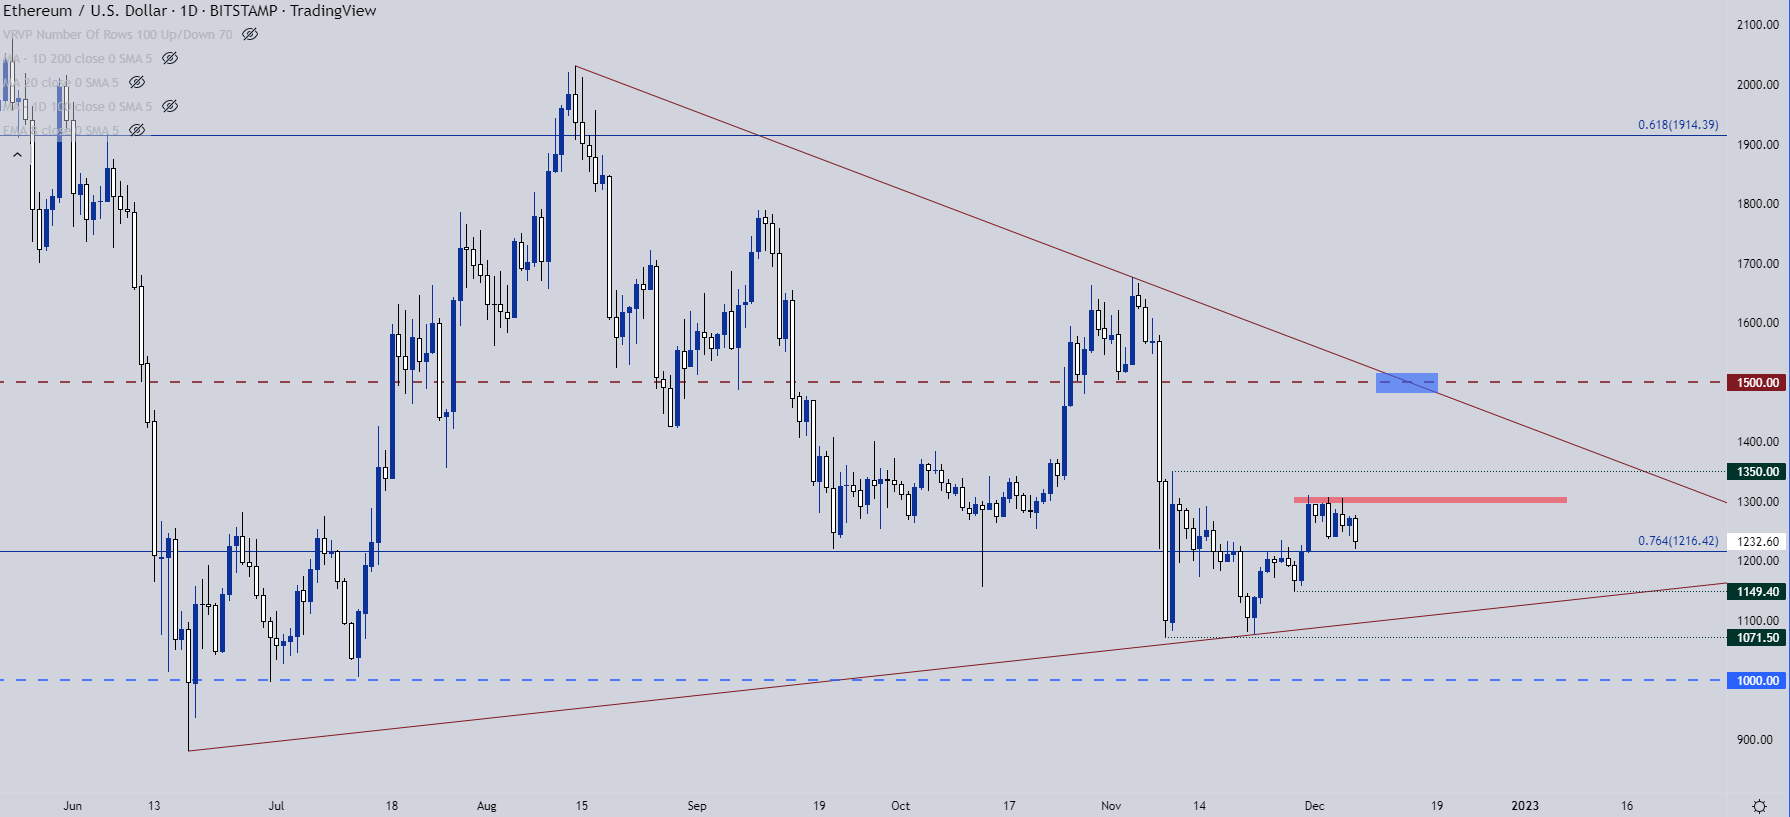
Chart prepared by James Stanley; Ethereum on Tradingview
More By This Author:
Canadian Dollar Price Action Setups: EUR/CAD, USD/CAD, CAD/JPY
S&P 500, Nasdaq, Dow: Key Support Zones Now In Play
Gold, Silver Price Forecast: Gold Snaps Back, Silver Tests Key Support
See my full risk disclaimer at dailyfx.com/risk-warning.


